View 3D Structure
3D visualization video tutorial on YouTube
Note
If you cannot access YouTube, we also put the video tutorial on Bilibili, please click this link.
g3d format
3D genomic structure data can also be displayed at the browser. g3d is a new format we developped for visualizing 3D structure data in the Browser. g3d format is a binary format based
in bed-like format of data contains x, y, z coordinates for each genomic bin. Documentations
for how to prepare .g3d file is available at g3dtools documentation.
G3d files can be submitted as custom tracks from Tracks -> Custom Tracks, or using a datahub. Submitting a g3d track will trigger a new panel opened in the browser, which also contains menu allows you to customize the visulization, like change resolution and decorating the 3D structure using bigwig (like GC percentage) or compartment annotations.
g3d track
From Tracks menu, choose Remote Tracks, choose g3d track type and paste the g3d file url, you can also input a track label which is optional.
Note
you can use our example file for testing purpose, this file is converted from data published in Three-dimensional genome structures of single diploid human cells, Science Vol. 361, Issue 6405, pp. 924-928 and the original data was obtained from NCBI GEO database.
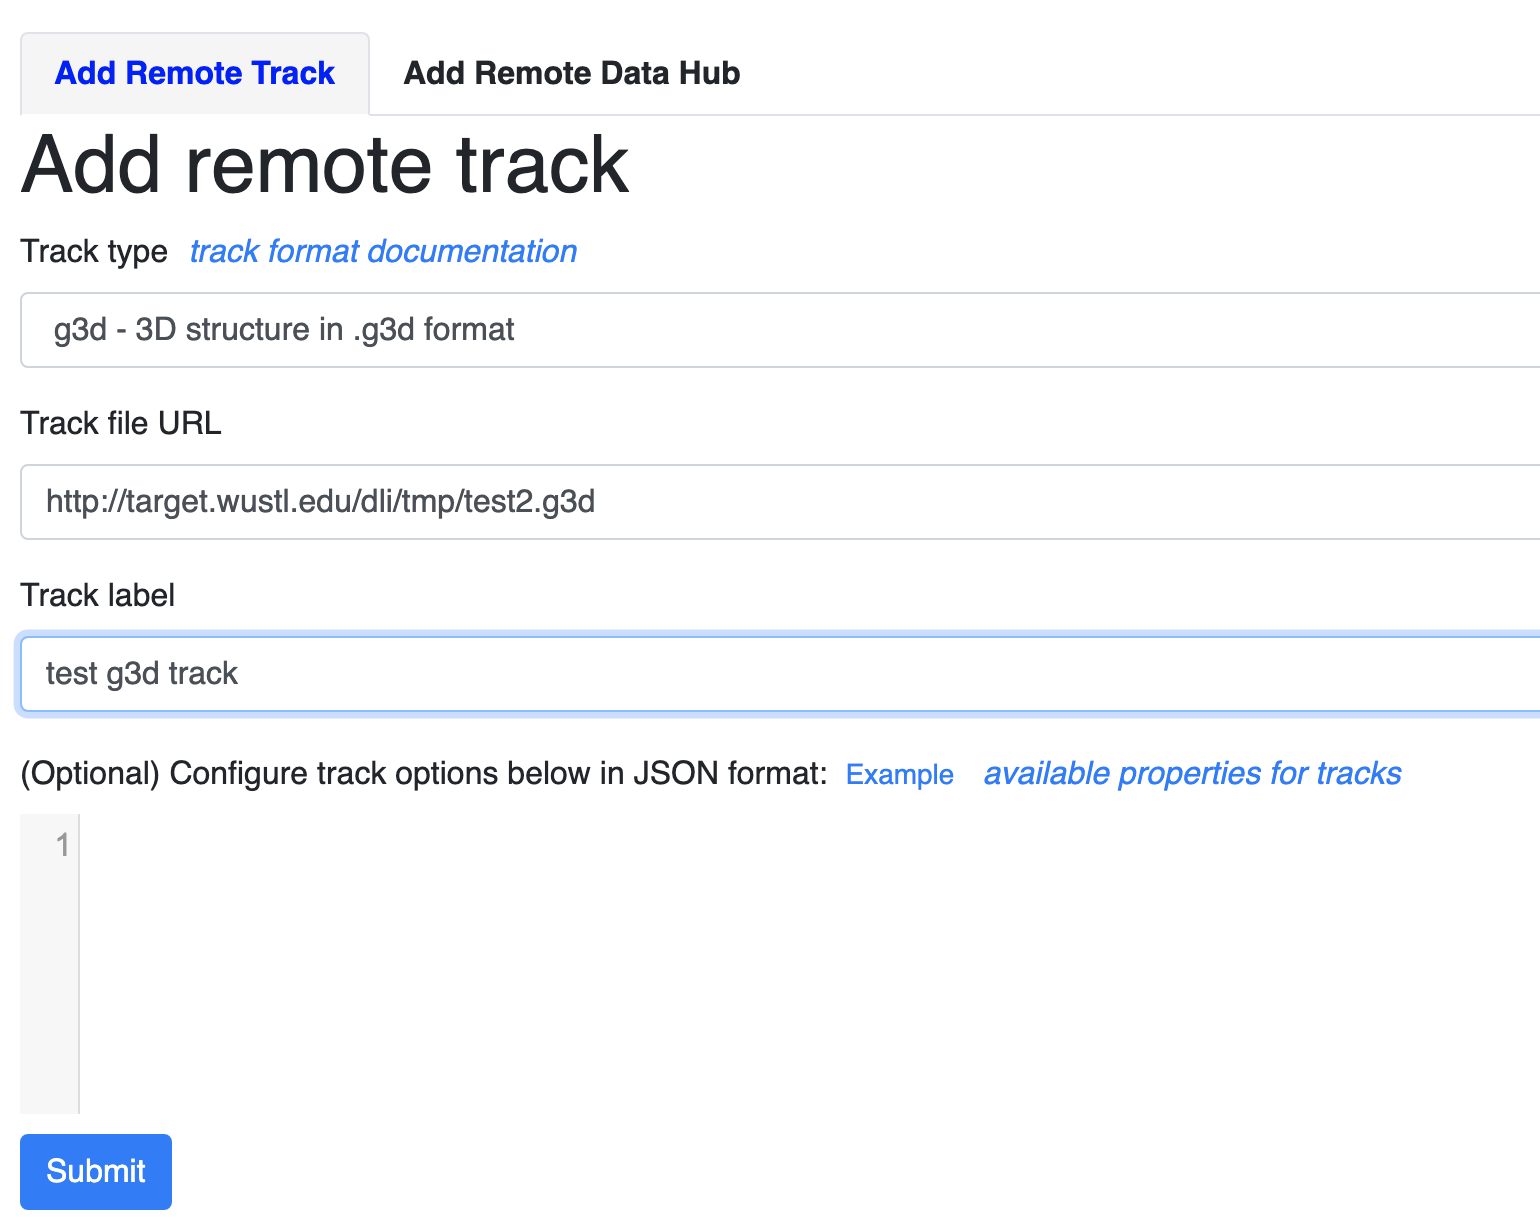
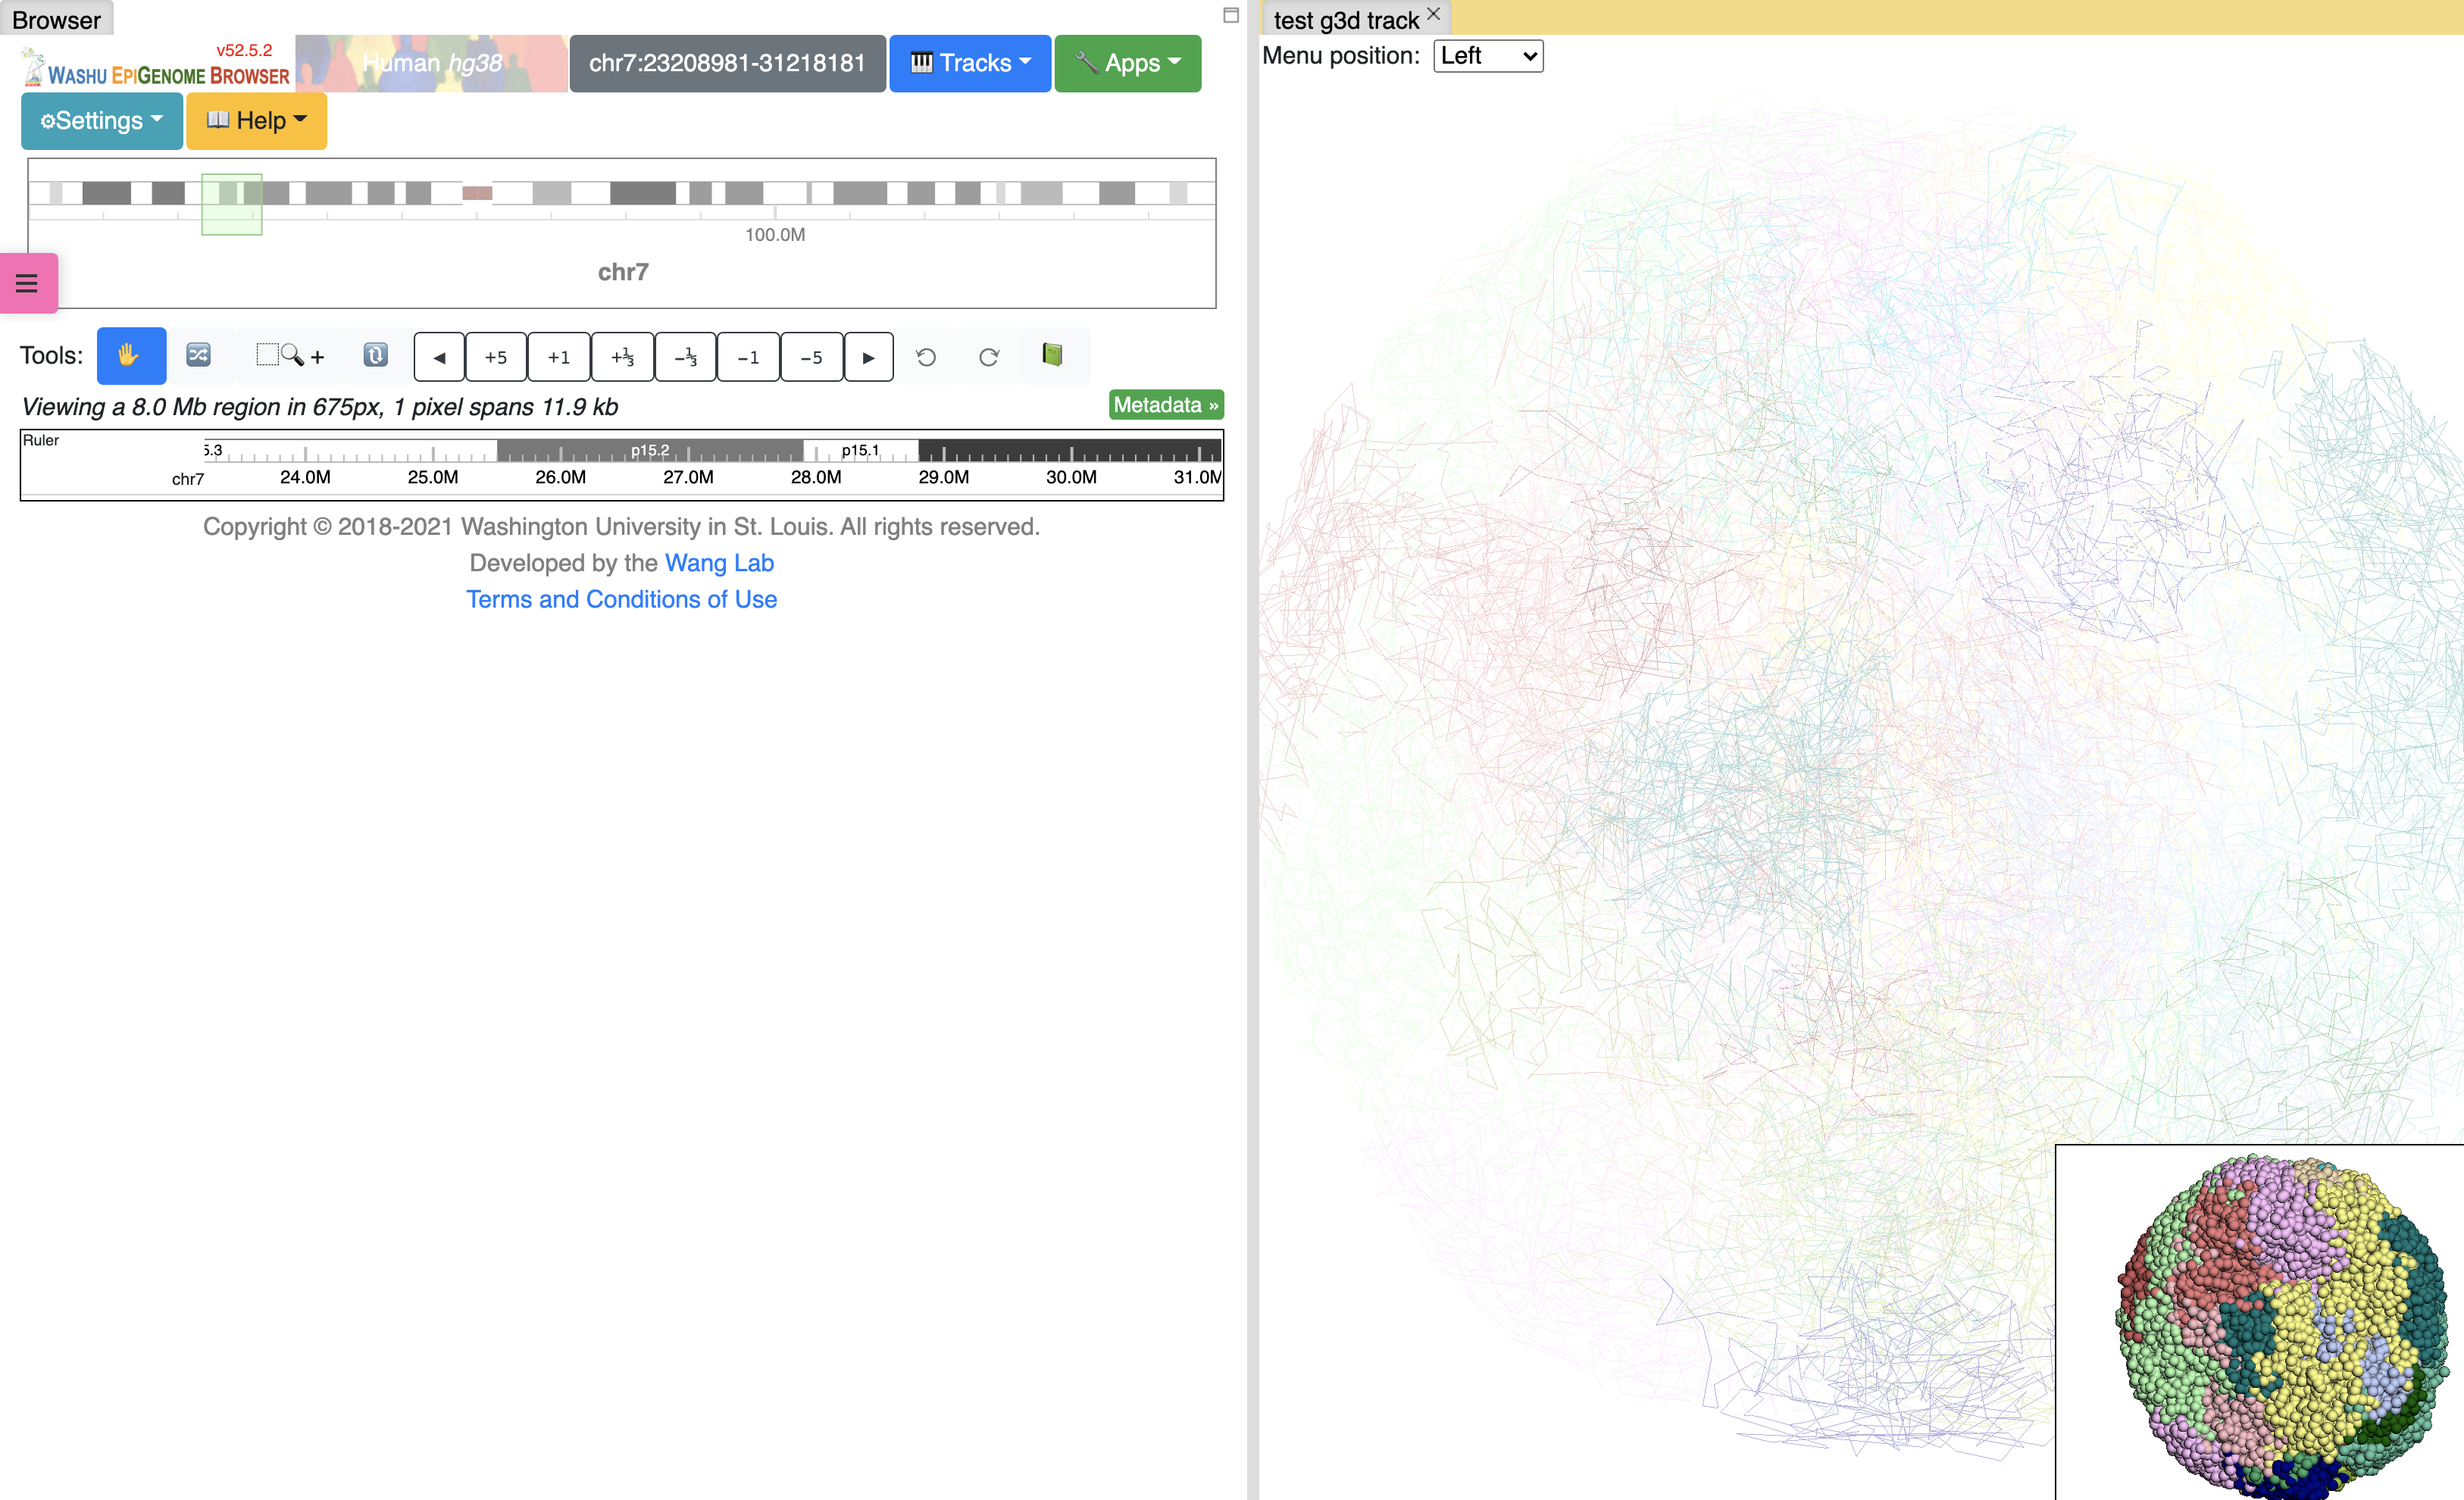
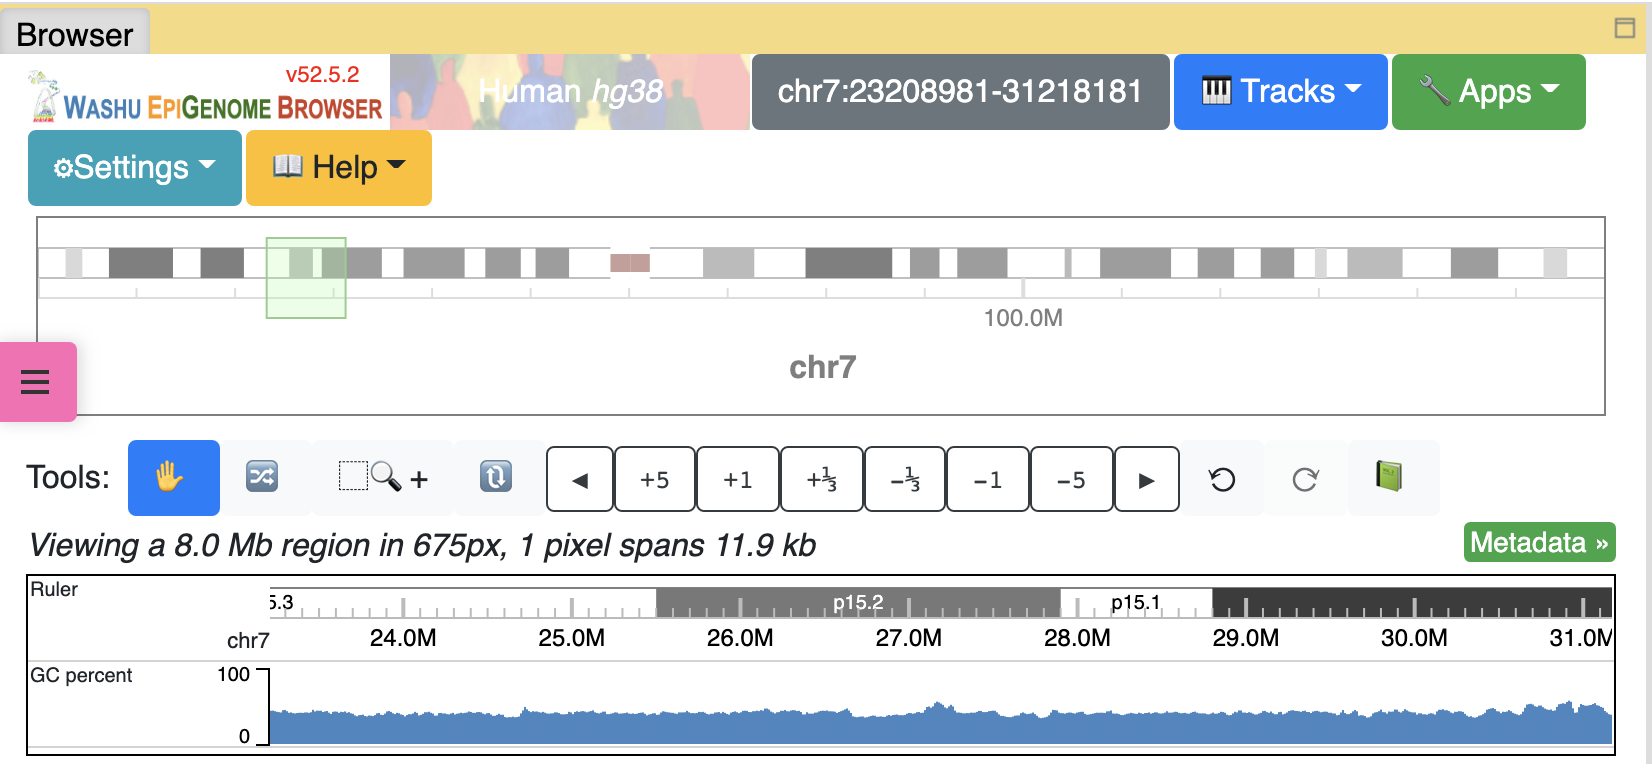
click the Submit button, close the Remote track panel, this is how it looks like with default view:
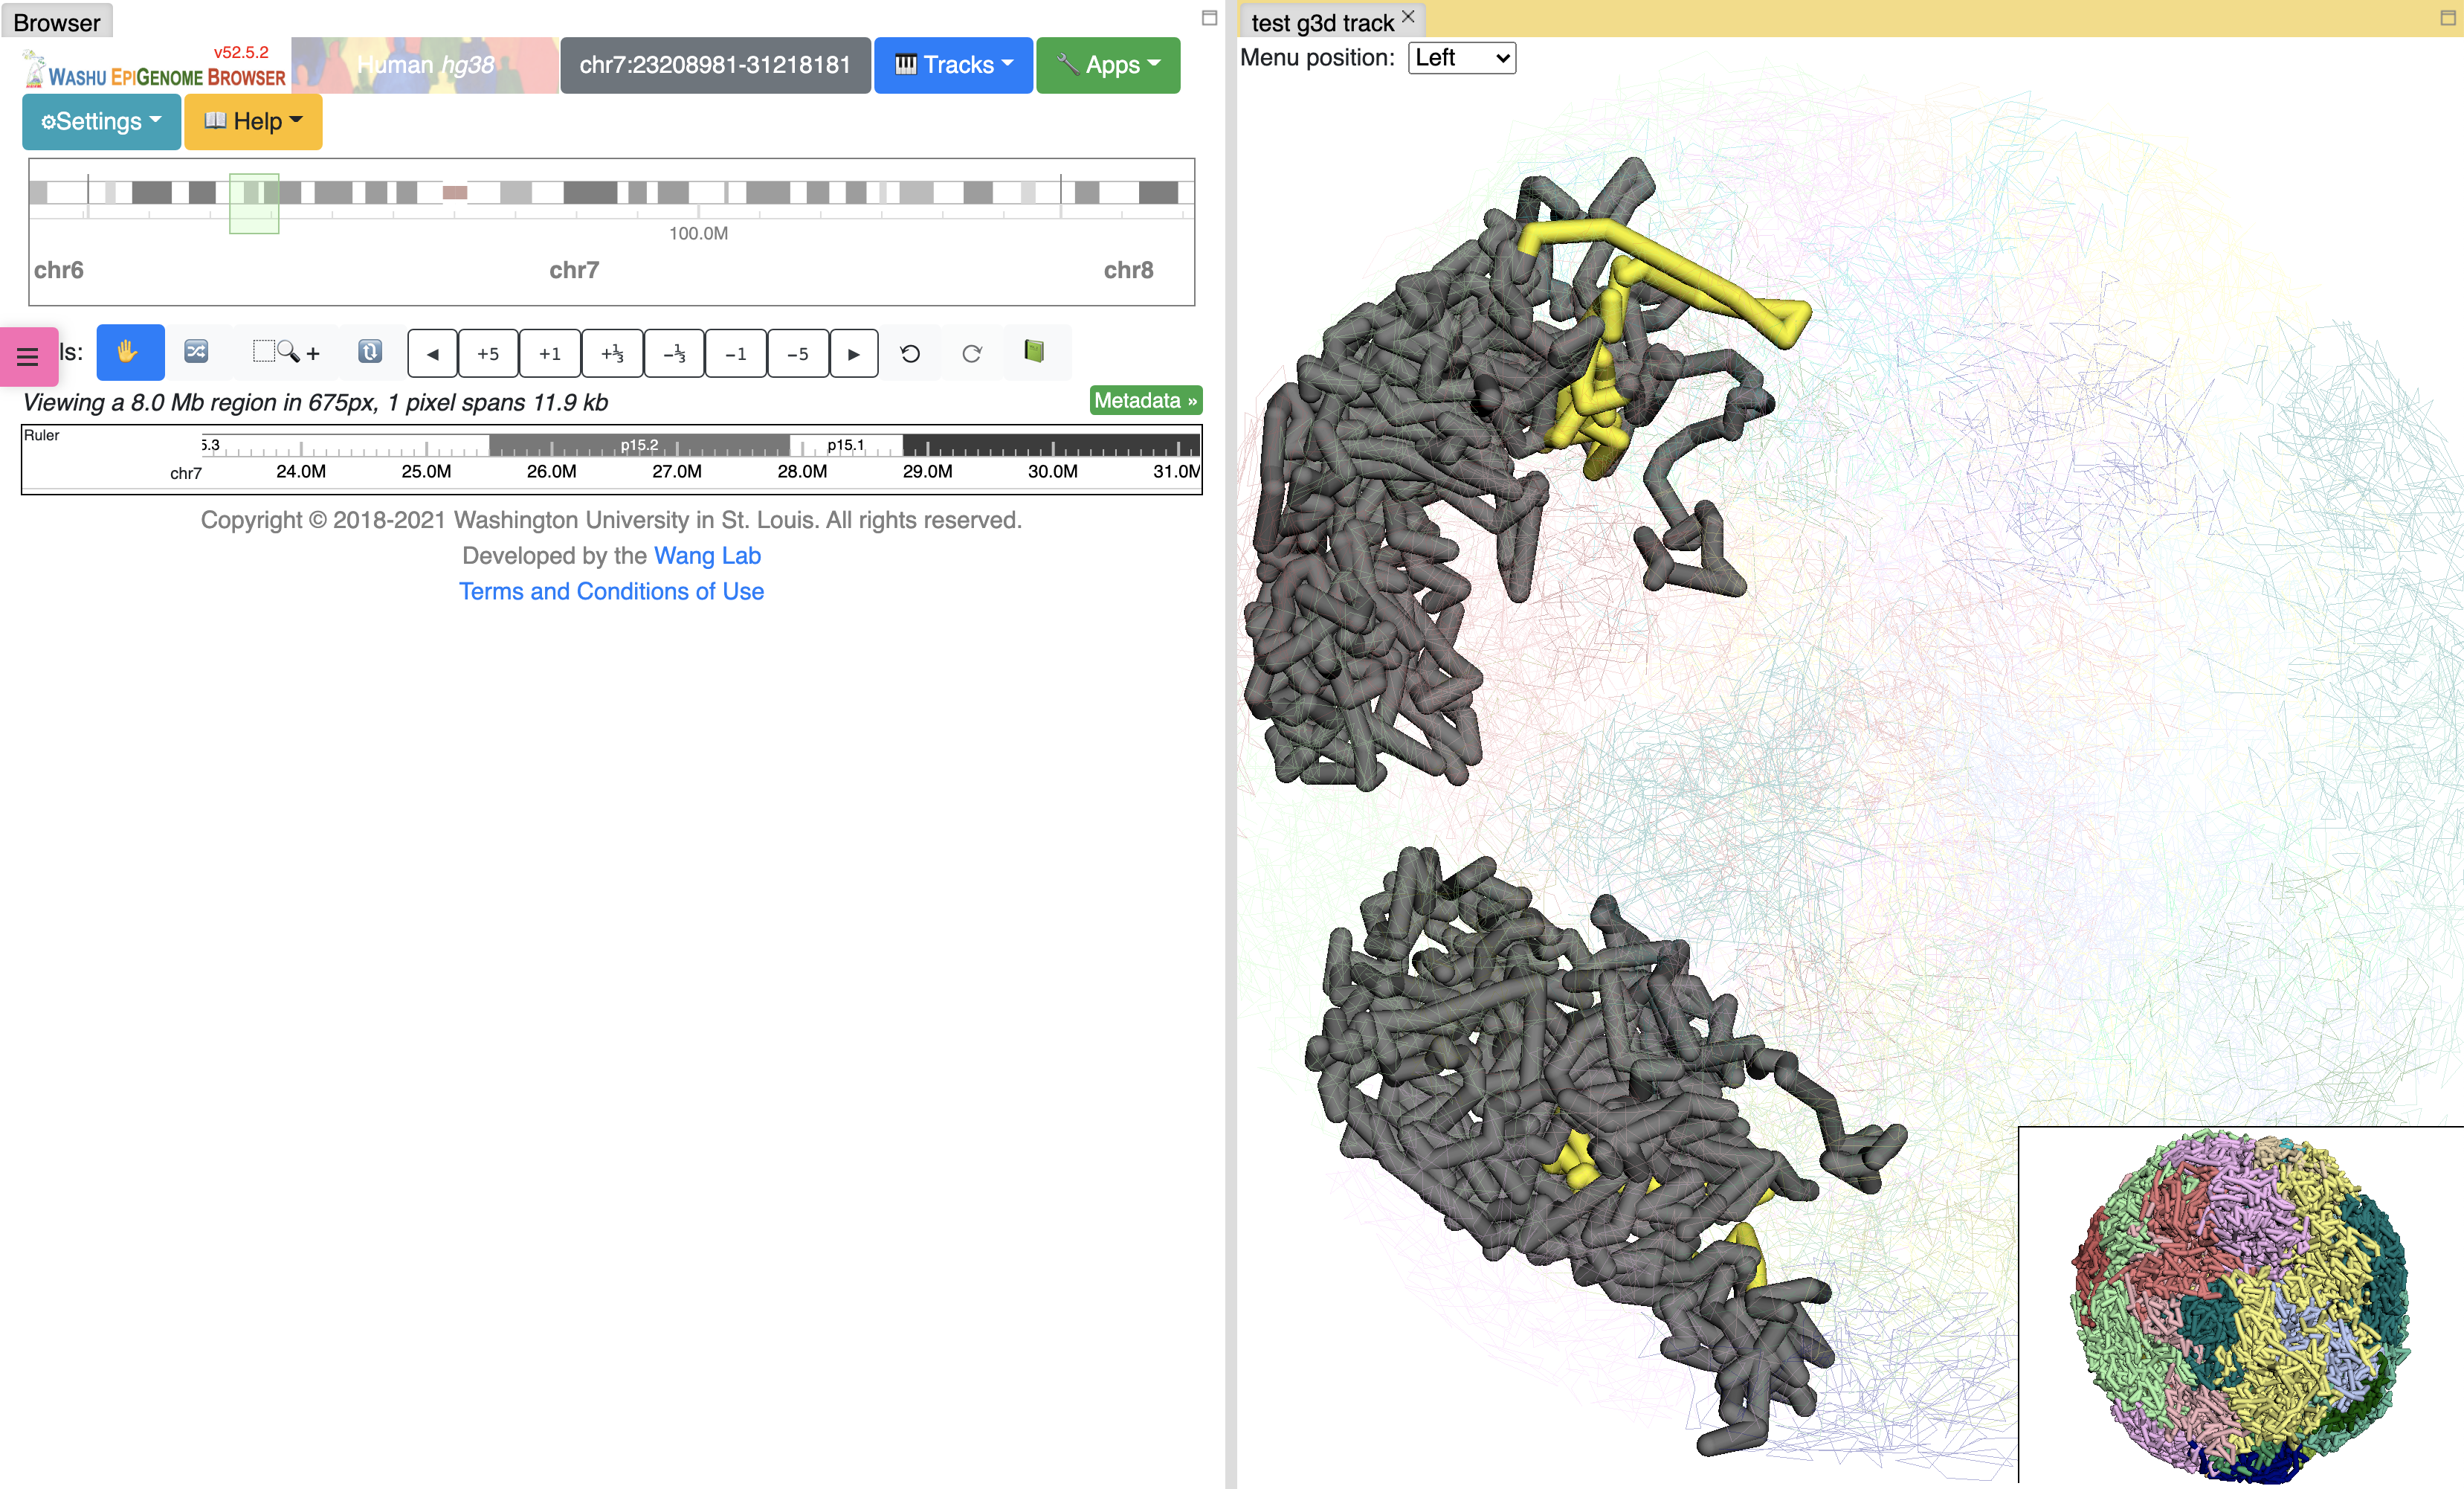
By default the 3D viewer contains main and thumbnail viewer, if you zoom/rotate in one of them, both of them will be synchronized. Yellow highlighted region indicates browser region, change region in browser will also change the highlighted region in yellow.
Note
by default the model will spin after intially loaded, you can disable the spin in configuration menu. Please see the instructions in the sections below.
3D viewer menu
Clicking the  button will open the configuration menu for the 3D visulization, which by default floats to the left of the screen, the menu is grouped to control the model data, layout, highlighting & labeling, painting, animation and export. Each group can be clicked to toggle expansion.
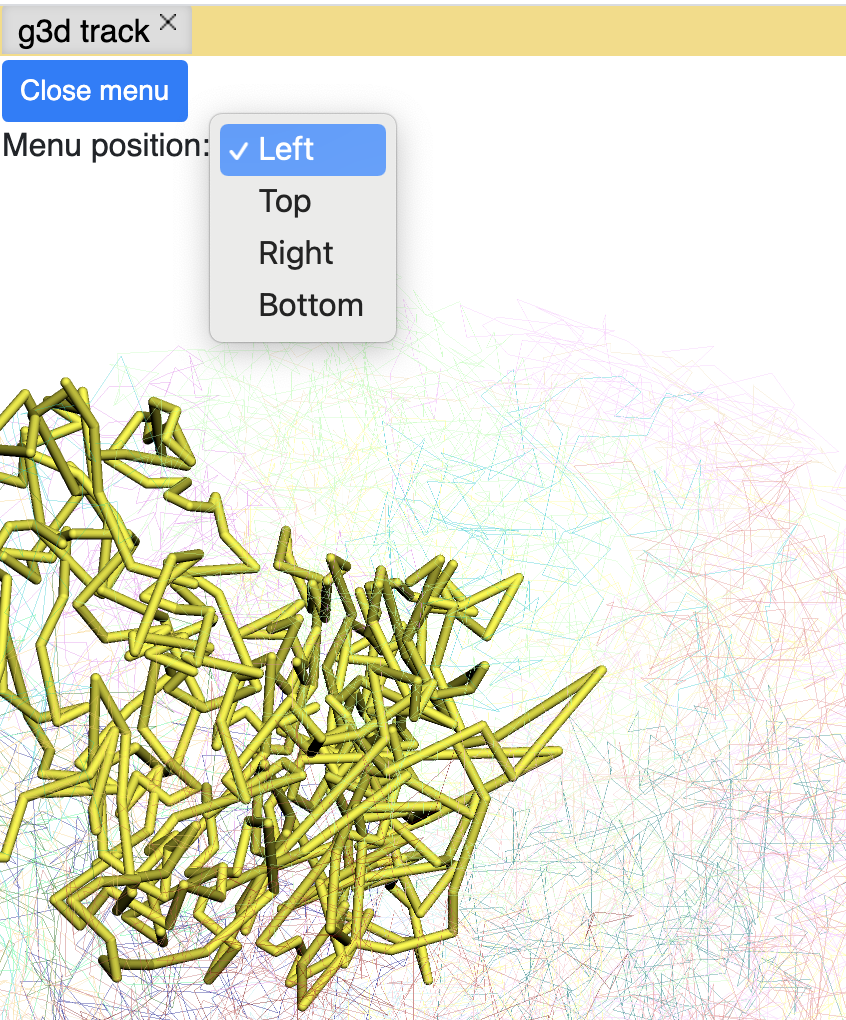
The menu icon position can also be adjusted using the dropdown menu on the 3D viewer:
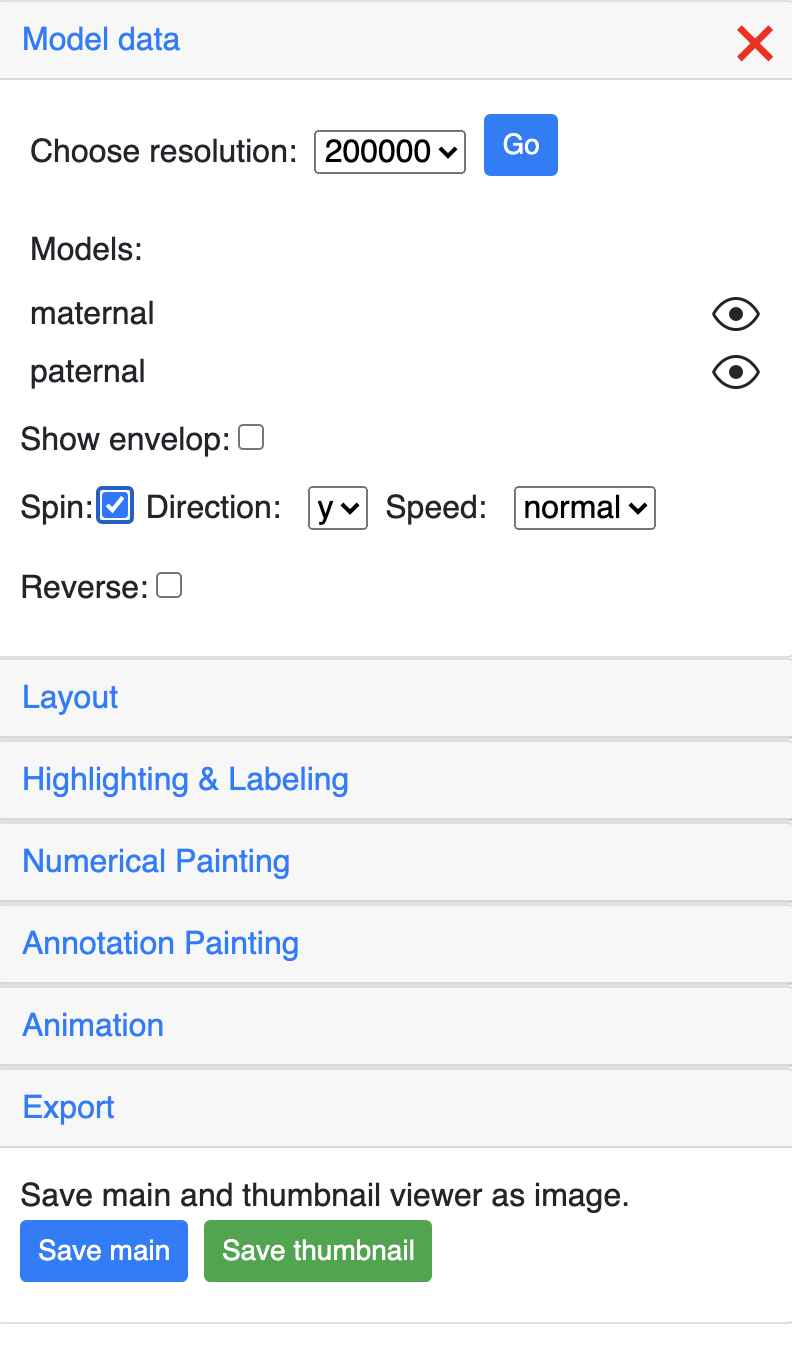
Config 3D model data
The Model data section can control the resolution of the g3d data.
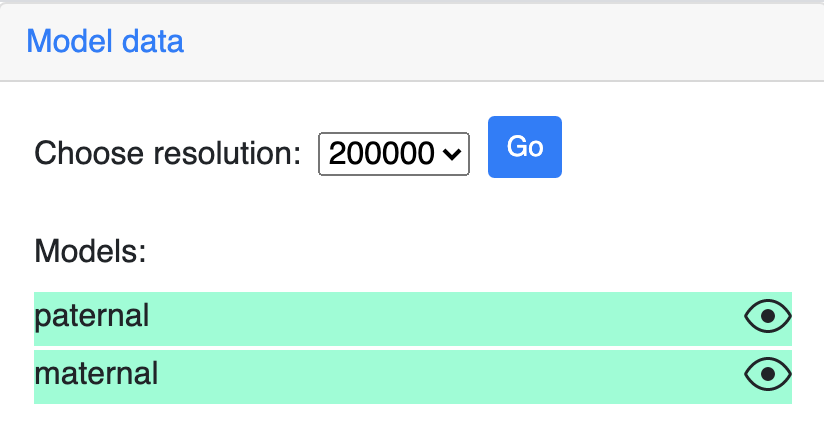
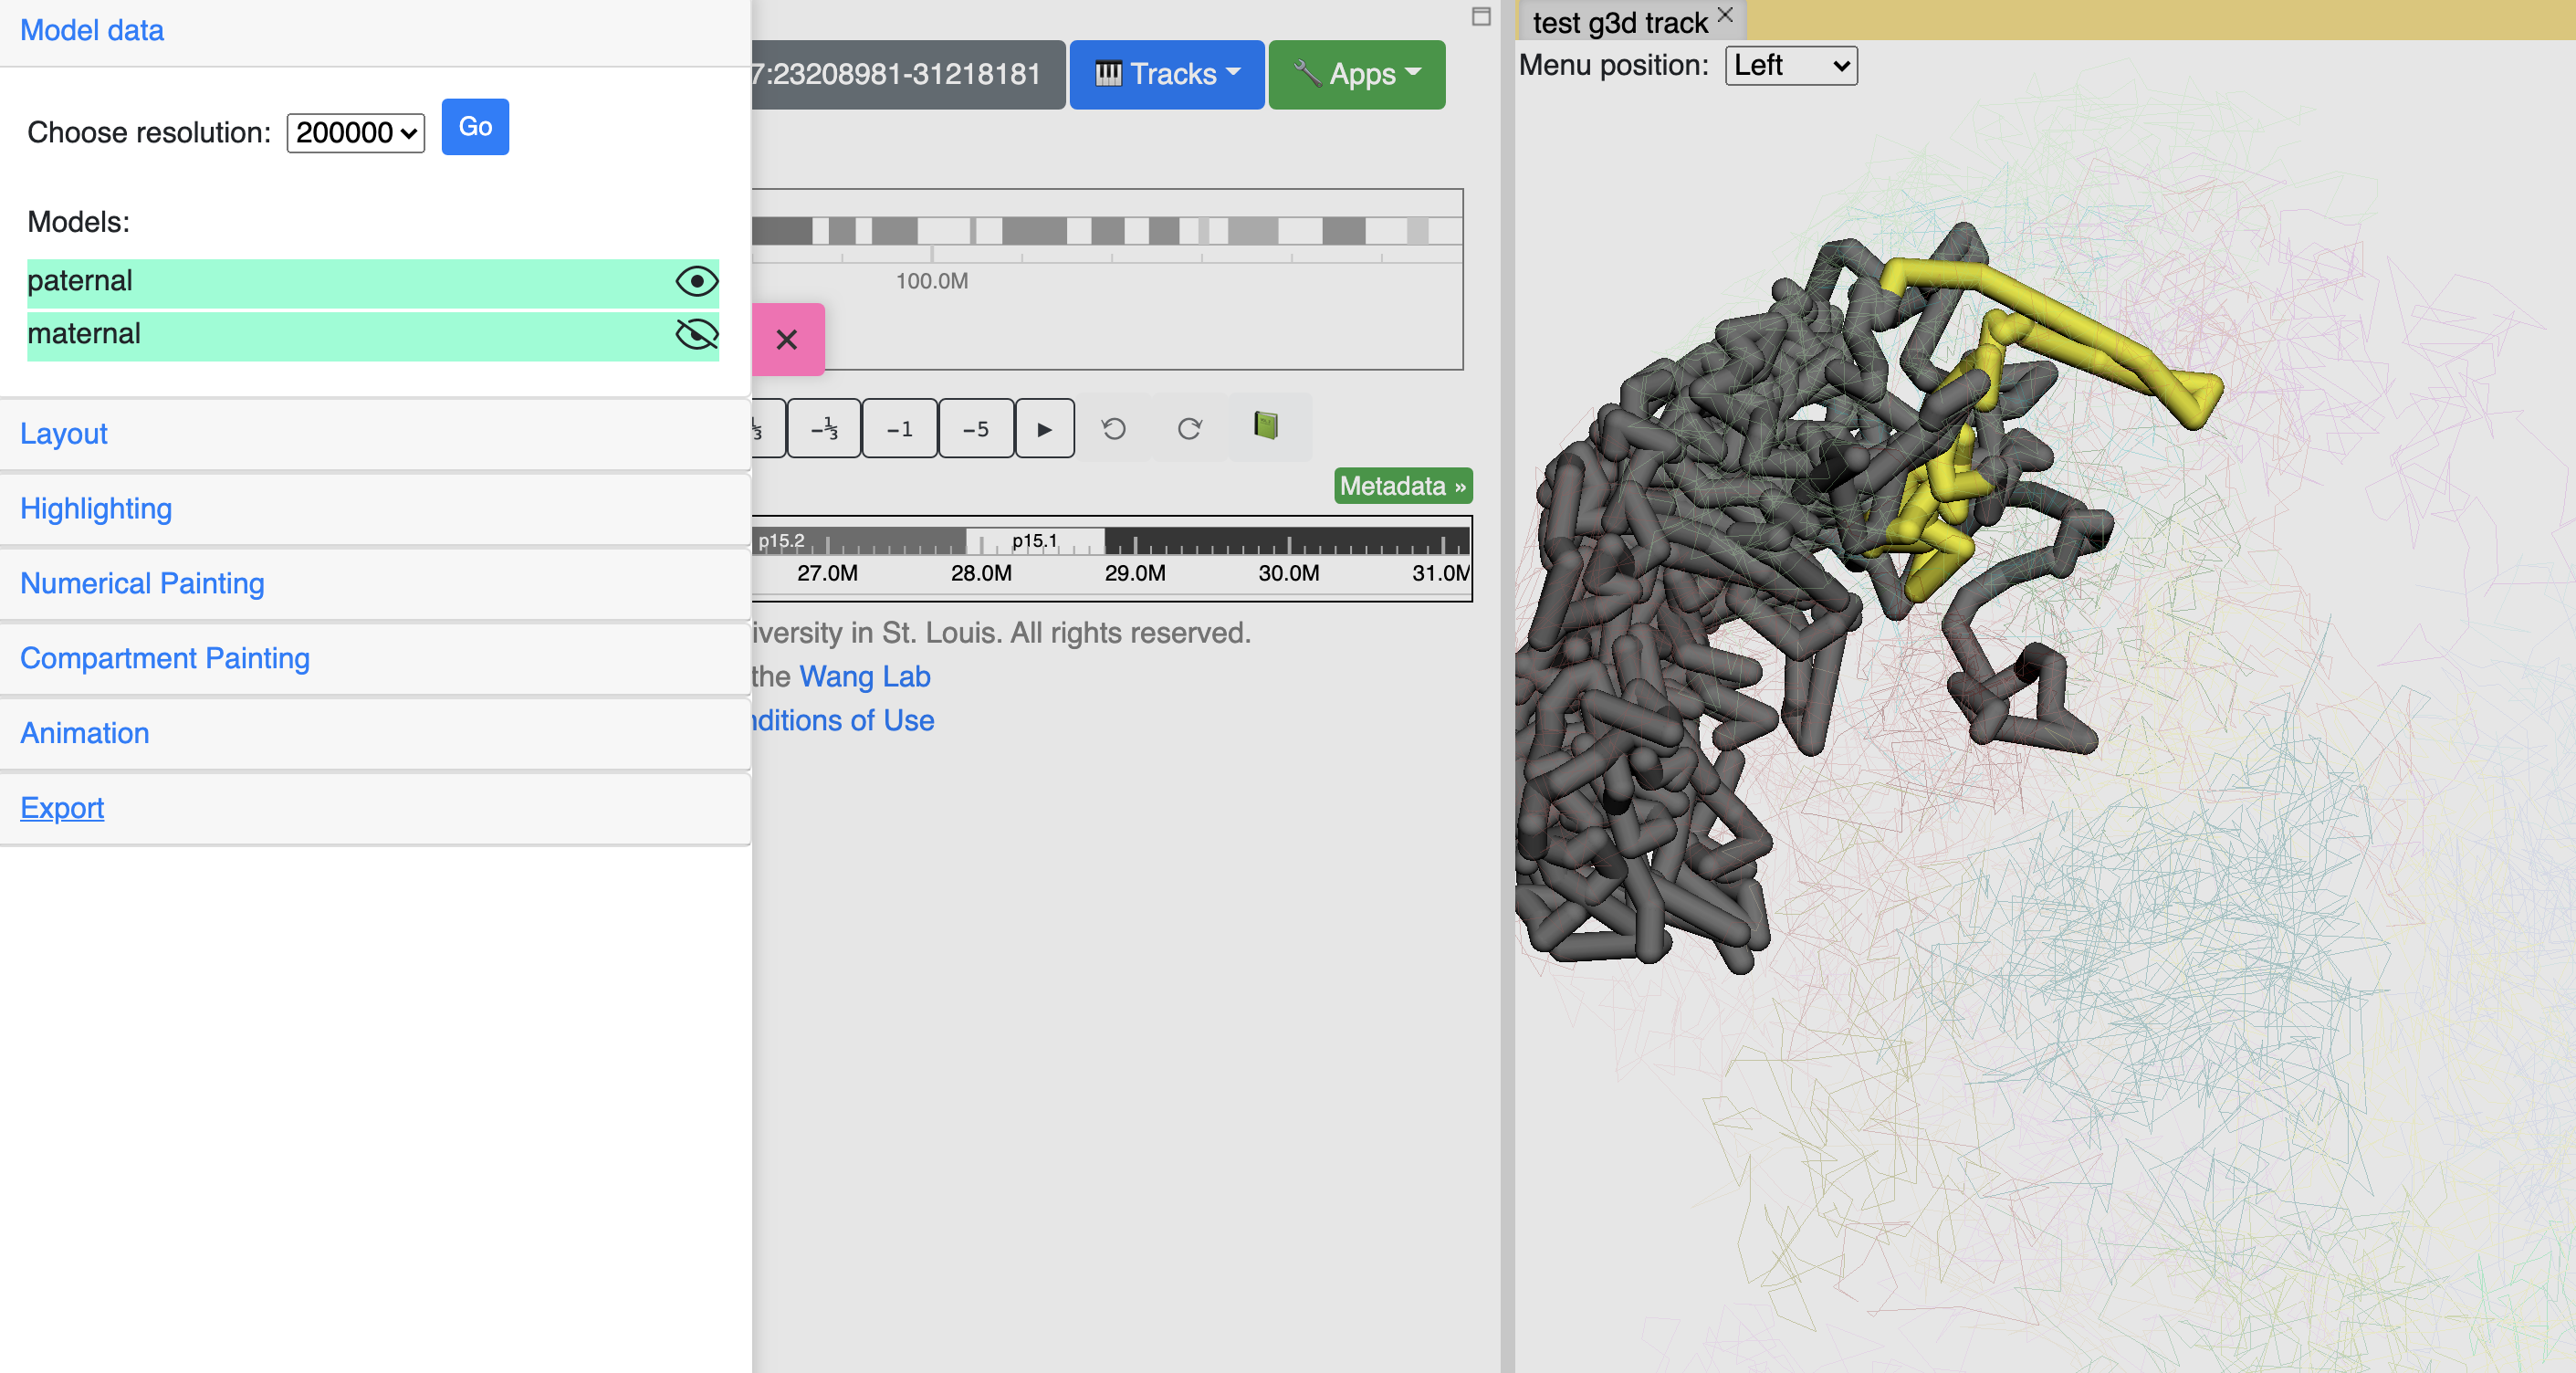
All the models in the g3d file will be listed here and can be displayed or hidden using the eye icon button. The example screenshot below indicates the maternal model is hidden by click the its eye icon:
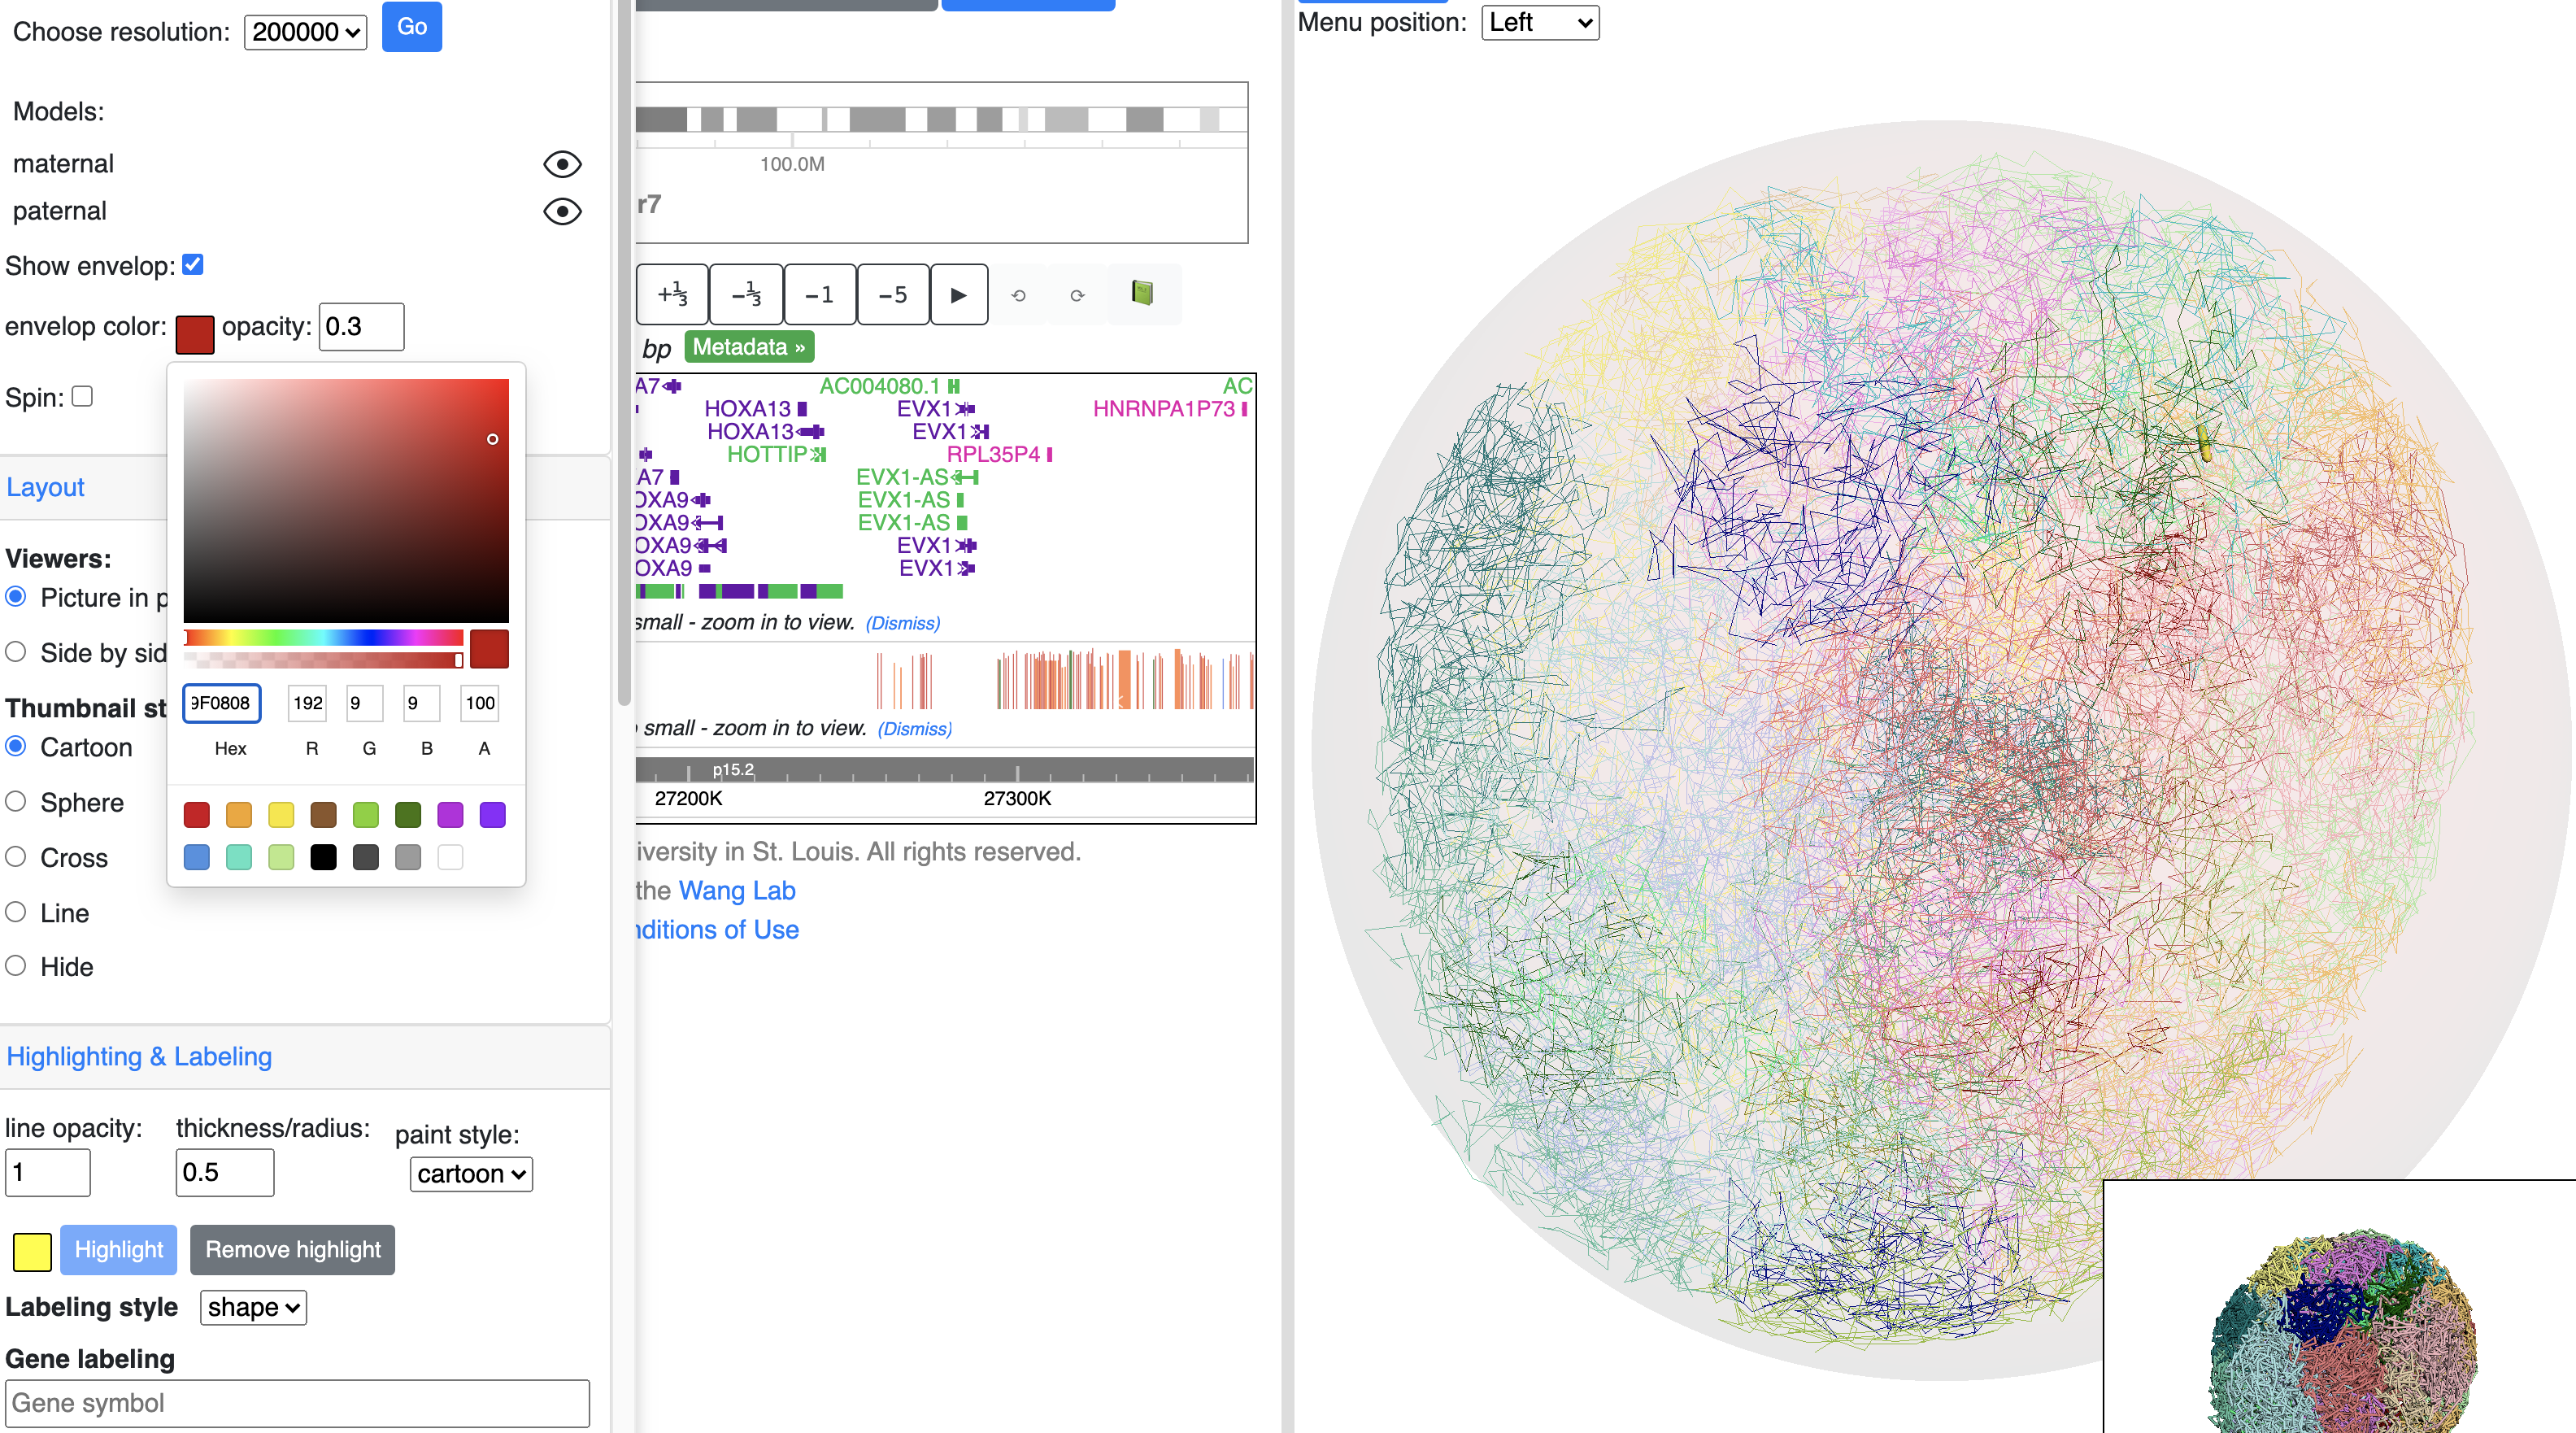
Show nuclear envelop
The 3d viewer uses an outer sphere to mimic the display of the nuclear envelop. Envelop can be configed to show or hide, color and opacity can also be customized.
Config the spin of 3d model
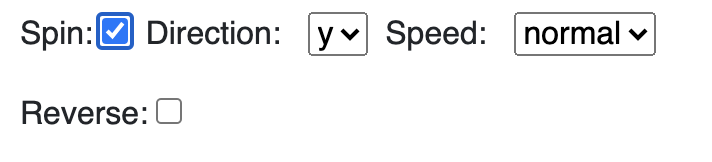
The model will spin after intially load, the spin section can used to toggle the spin status, and control the direction, speed of the spin.
Config 3D viewer layout
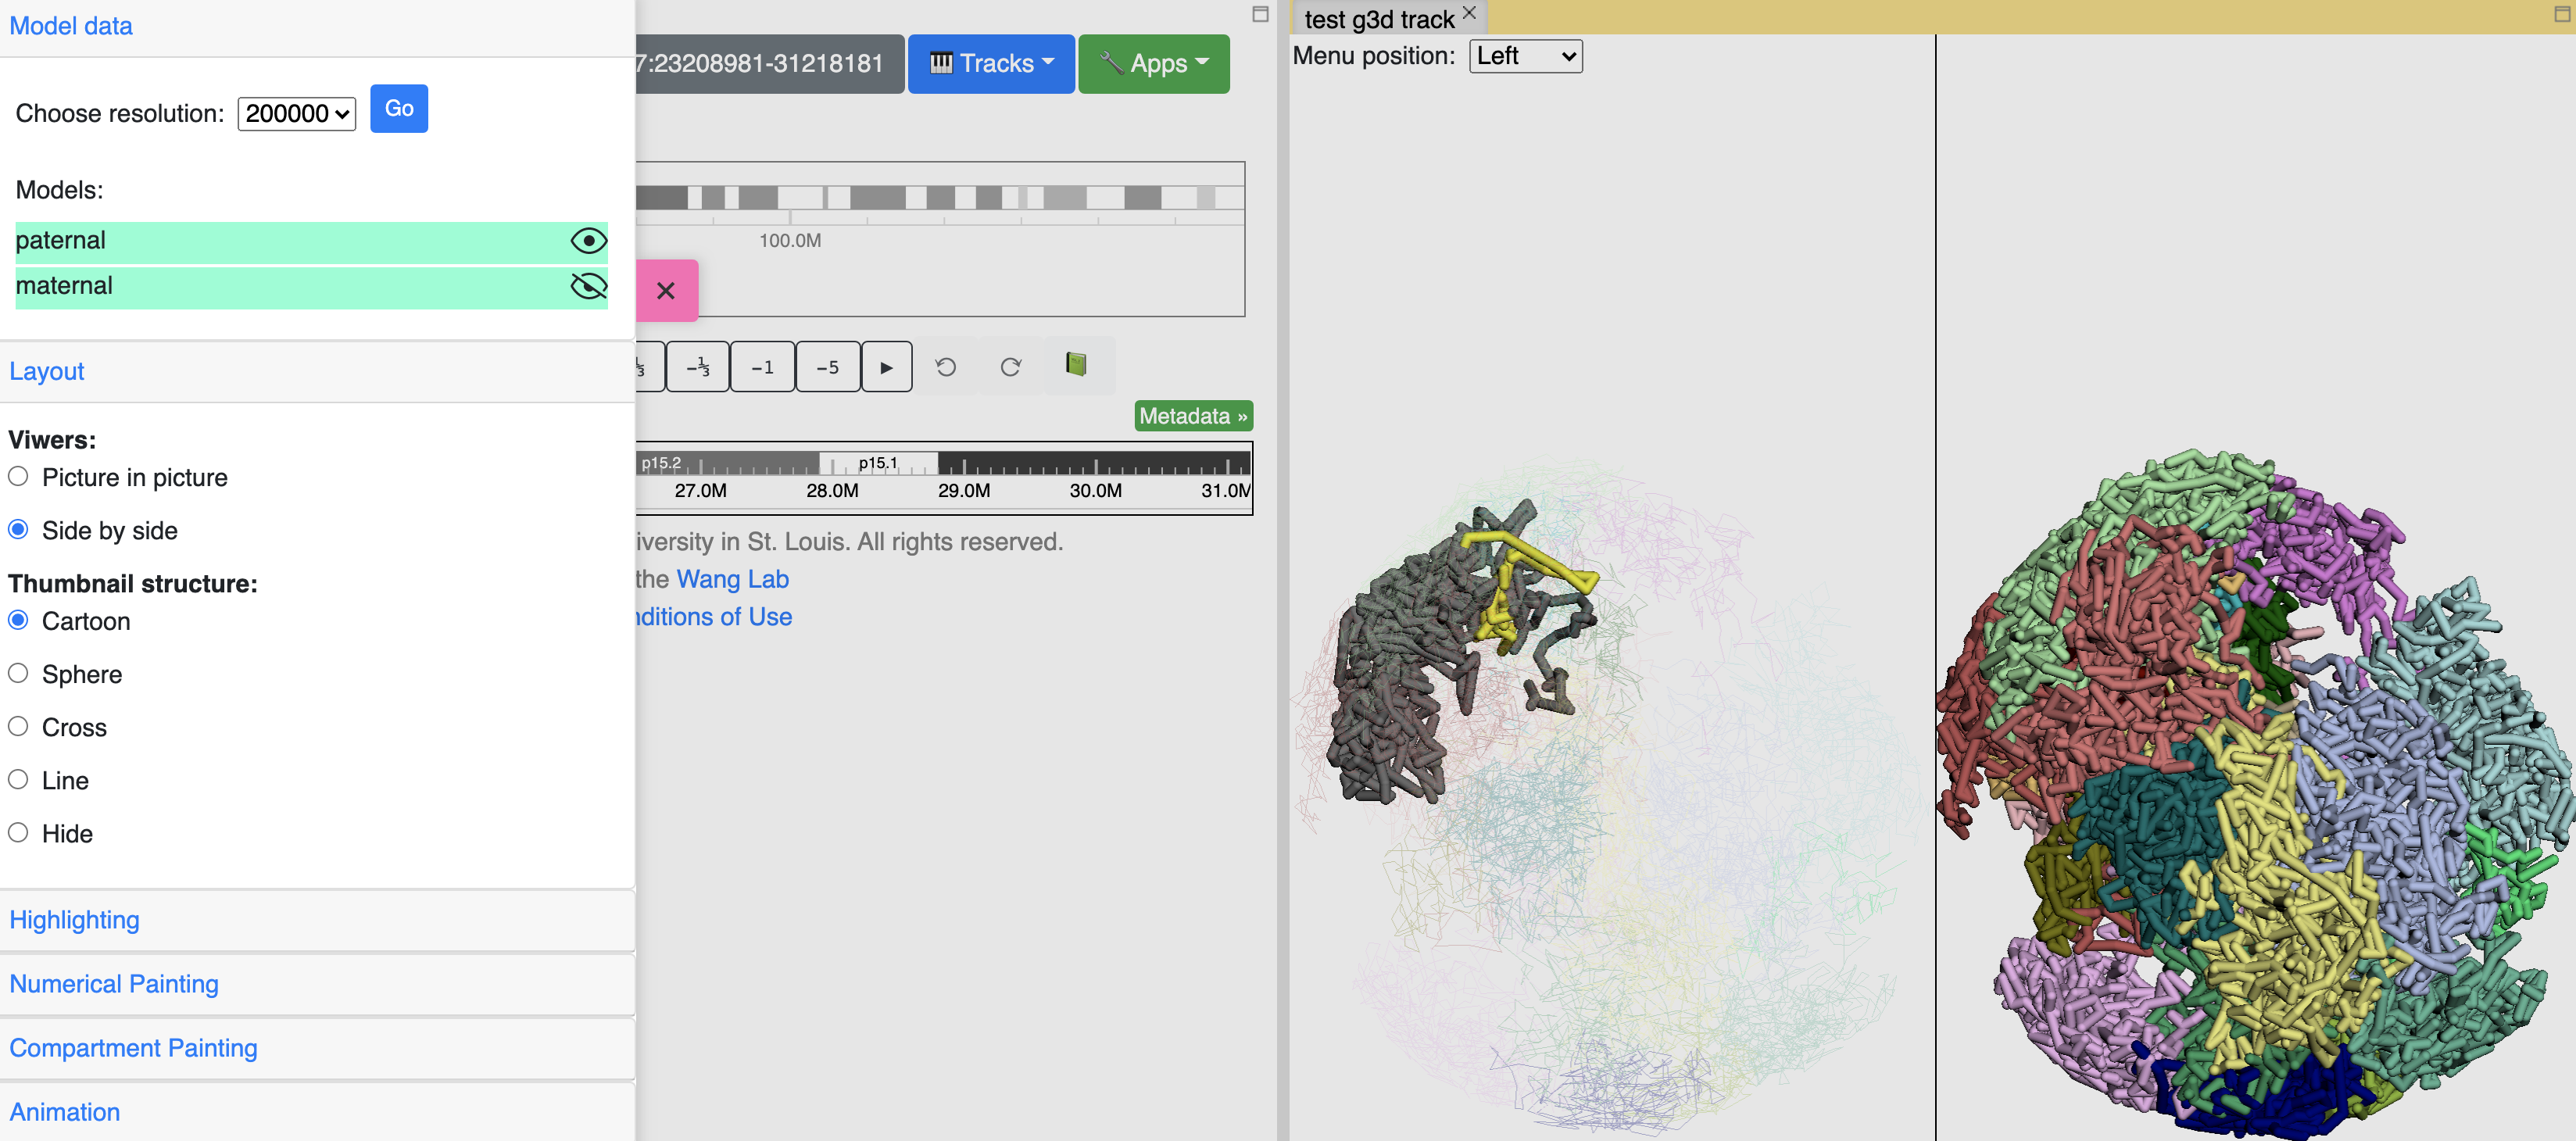
The Layout section is used to control the layout of main and thumbnail viewer.
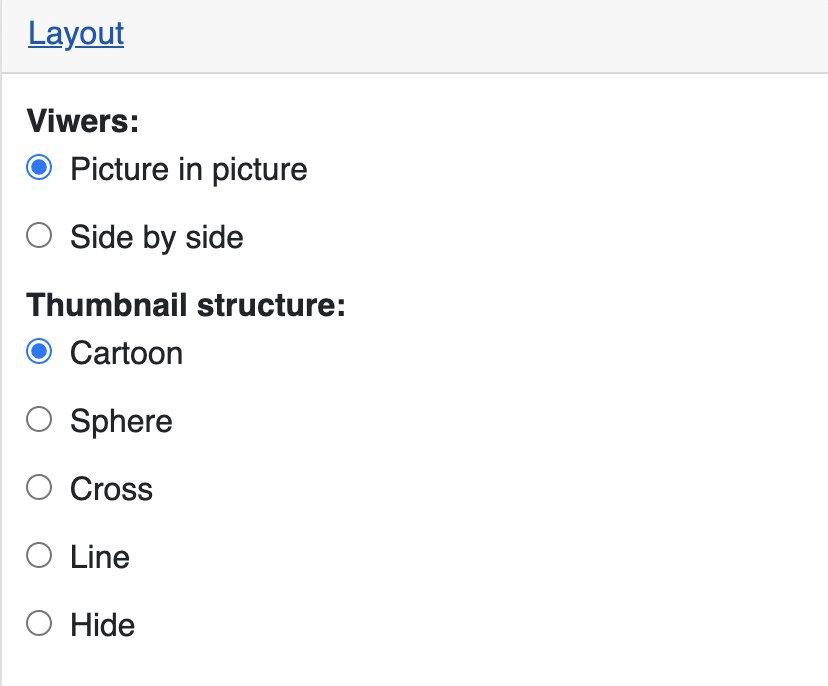
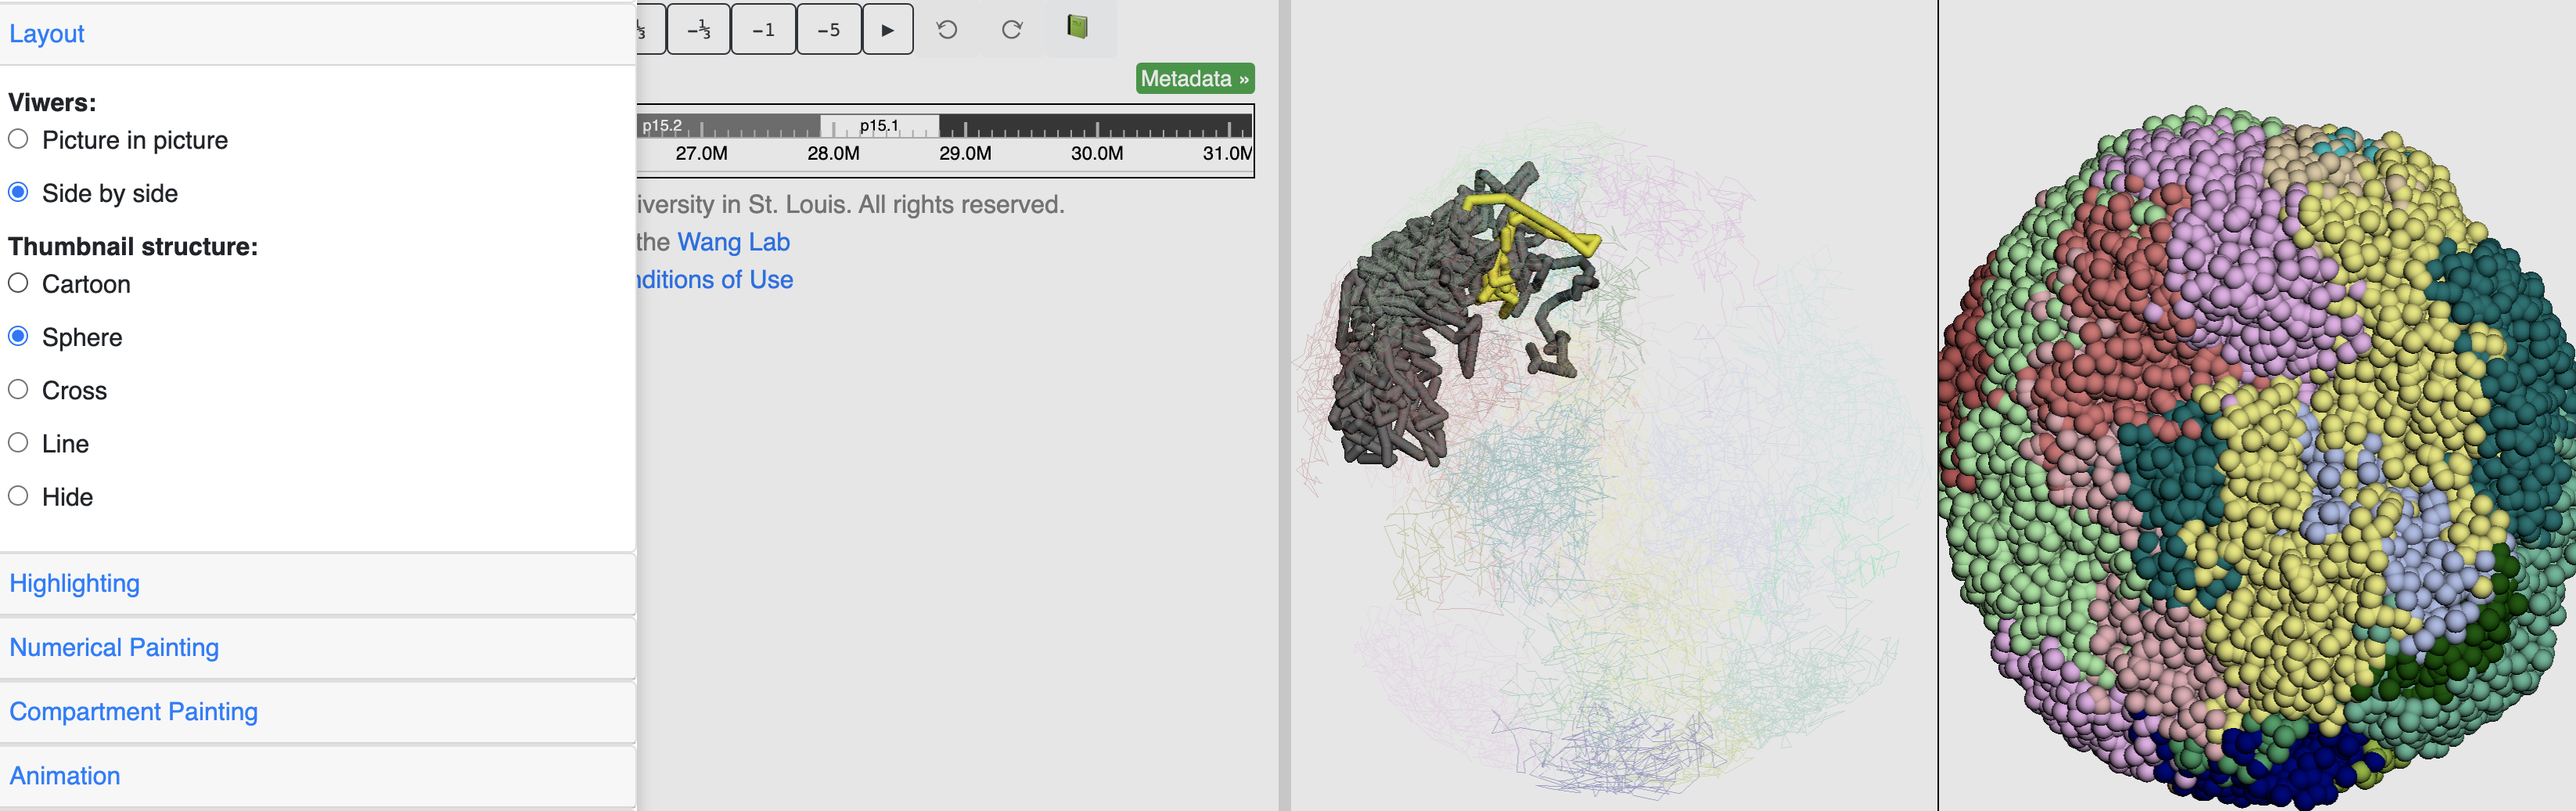
Change the view layout to side by side:
You can also change how the thumbnail structure looks like, for example, sphere style as below:
Highlighting & labeling
Toggle browser region highlighting
By default the main viewer would highlight the structure part belongs to current browser region in yellow, the Highlighting section is used to control this behaviour, click the Remove highlight will turn off the highlighting.
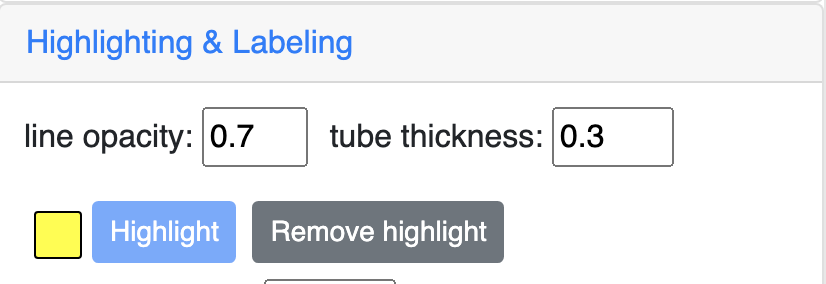
This is how it looks like when the highlighting is turned off:
Customize highlighting
Highlighting color and tube thickness can be customized to get a different viewer. As shown below, we changed the color to purple and thickness to 1:
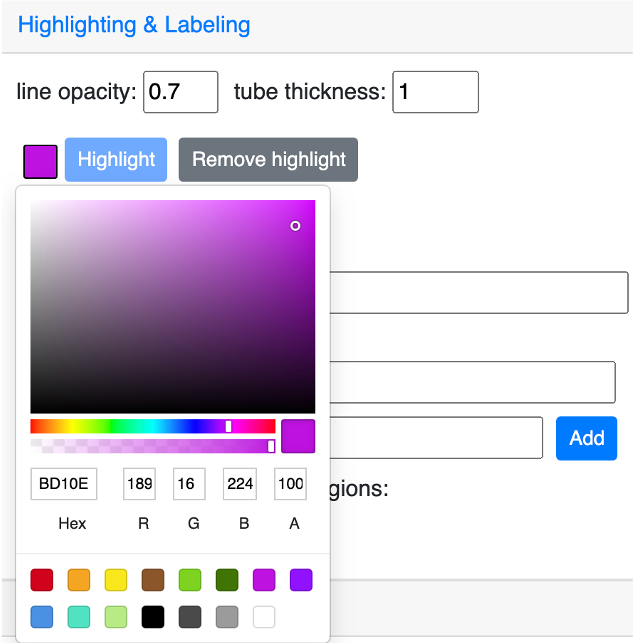
and this is the updated and view:
Labeling by gene
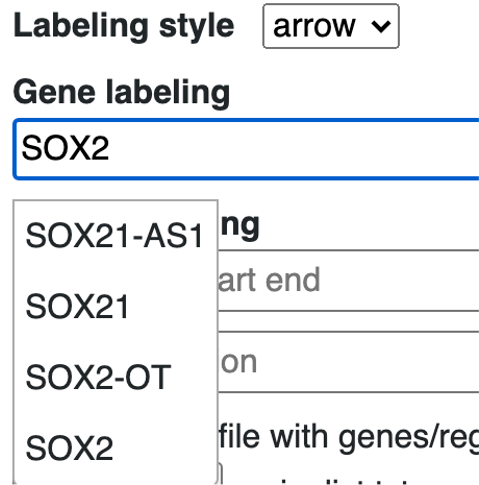
Gene symbol can be searched for labeling, start with search any gene symbol, the menu will auto complete the search based on users’ input.
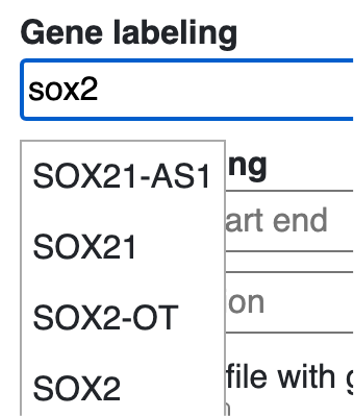
choose the isoform wanted:
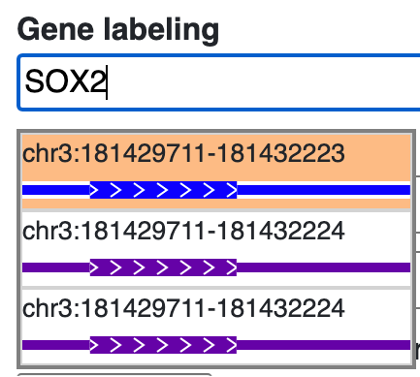
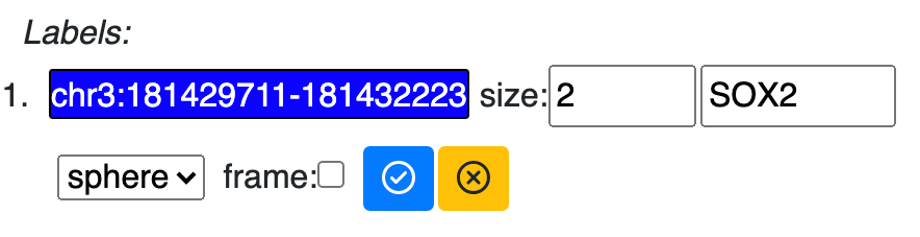
the gene will be added as a new label in the label list:
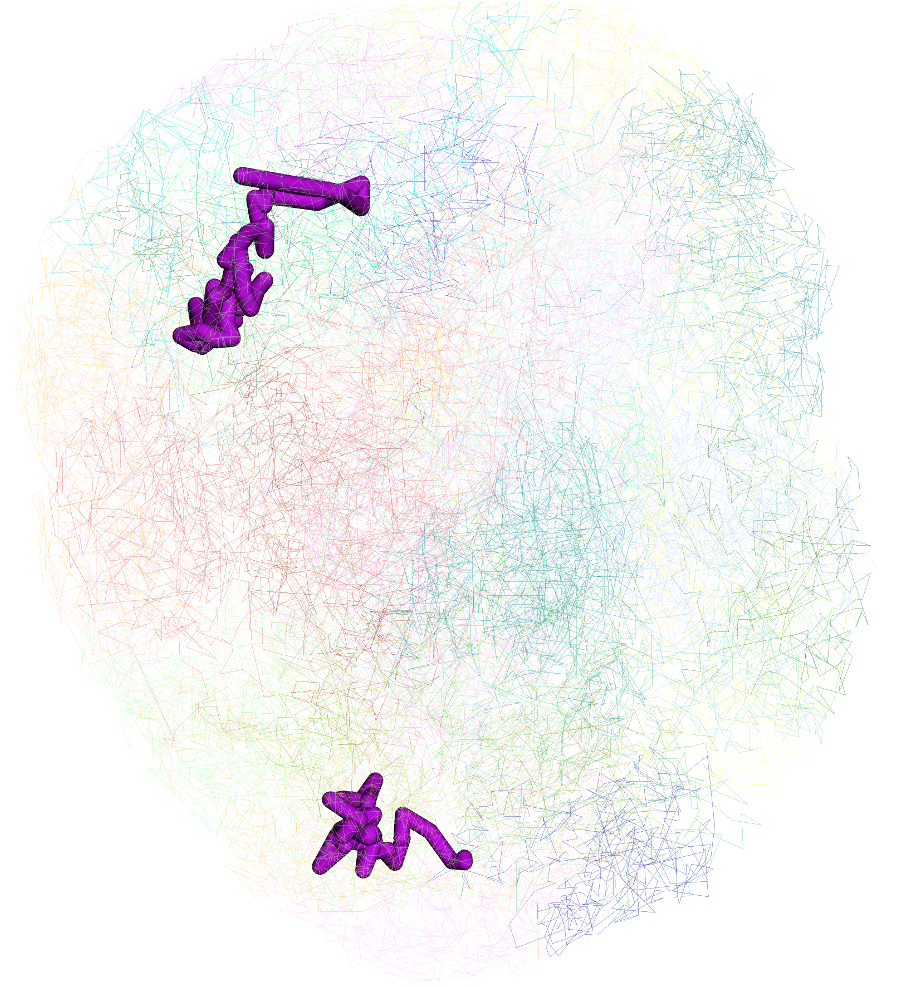
and shown in 3D view:
update the display style of the label:
updated view of the label:
Labeling by region
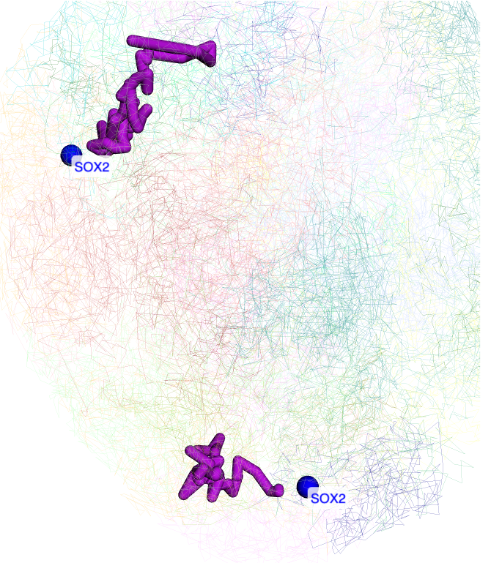
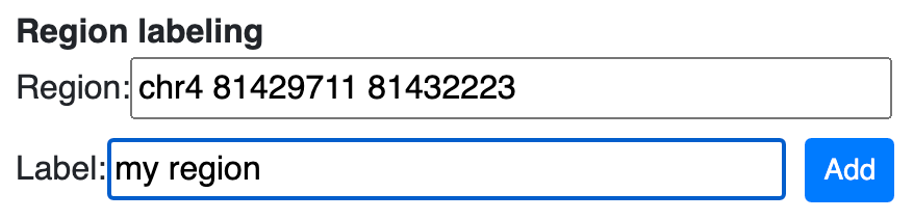
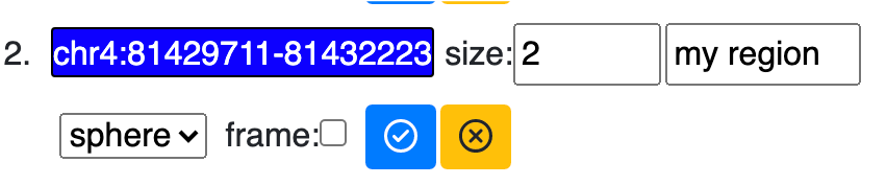
User can also manully type a region for highlighting:
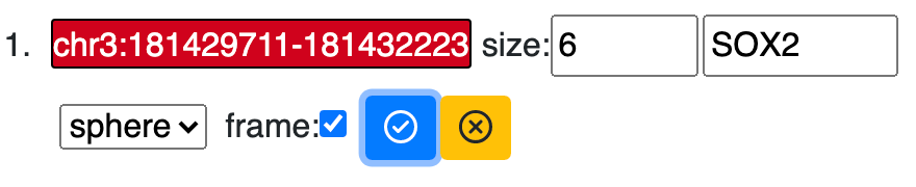
the added label by region search by also be updated in the menu control:
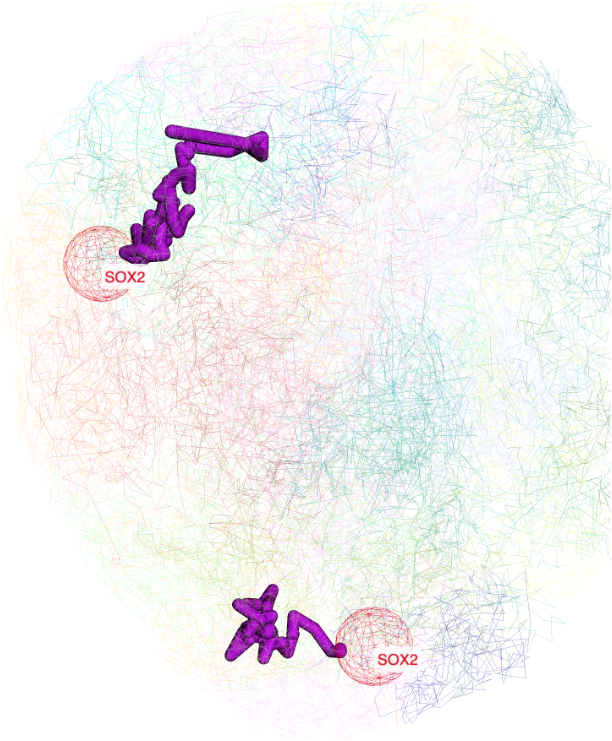
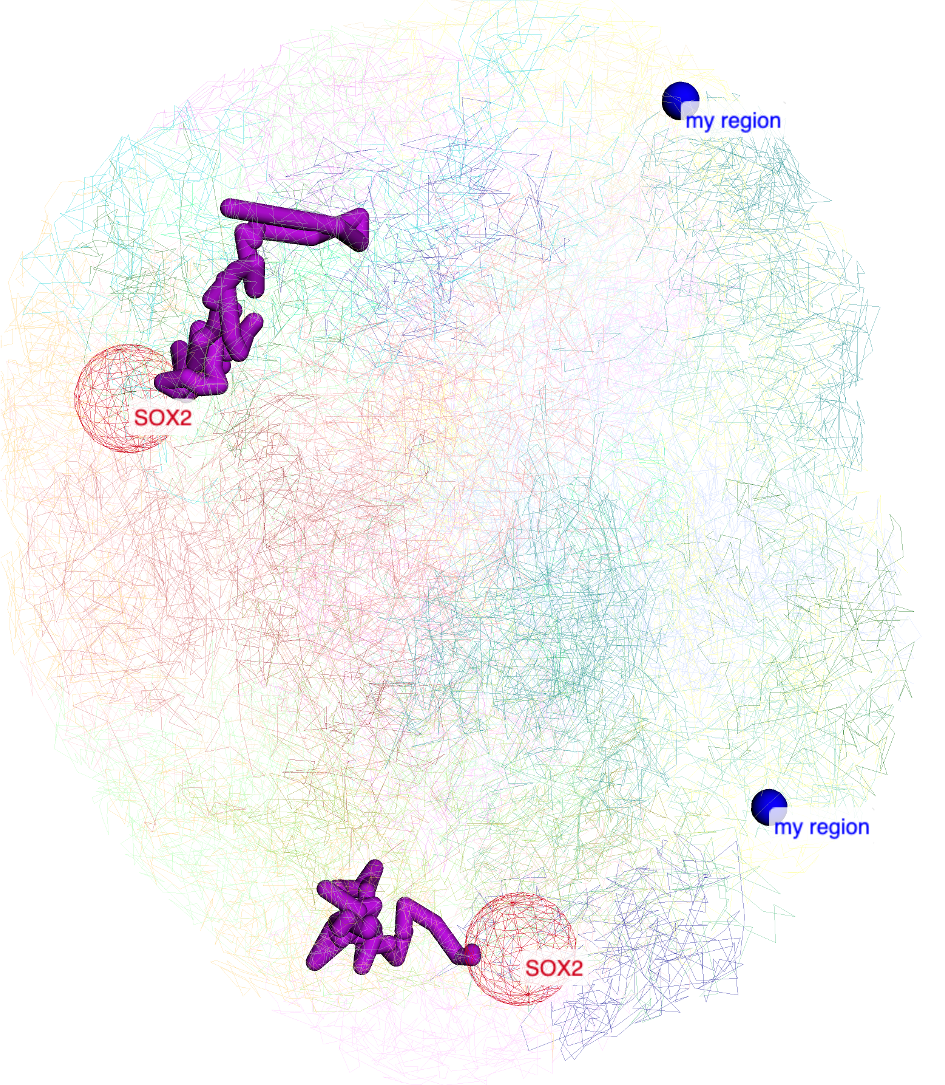
the view after added region label:
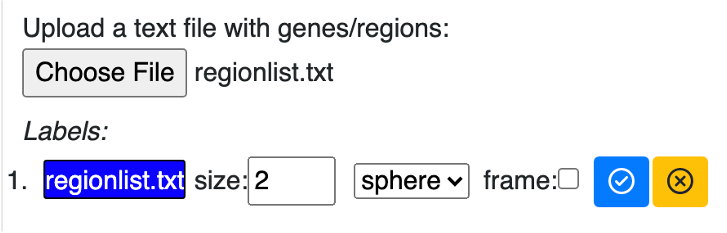
Upload a file for labeling
A text file contains list of regions/gene symbols can also be uploaded for batch labeling, as shown below, the text file contains content:
CYP4A22
chr10:96796528-96829254
CYP2A6
CYP3A4
chr1:47223509-47276522
CYP1A2
upload this file:
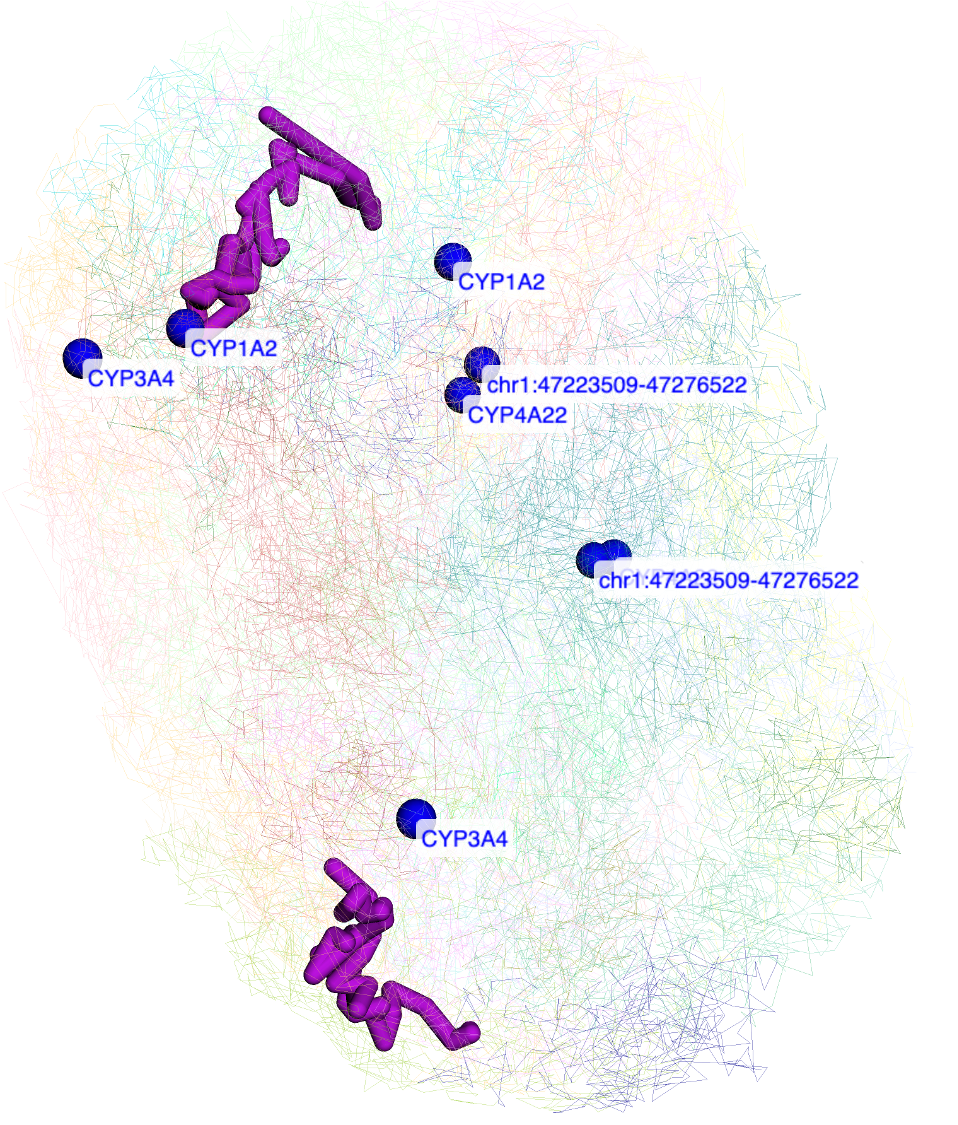
regions in the file are all labeled:
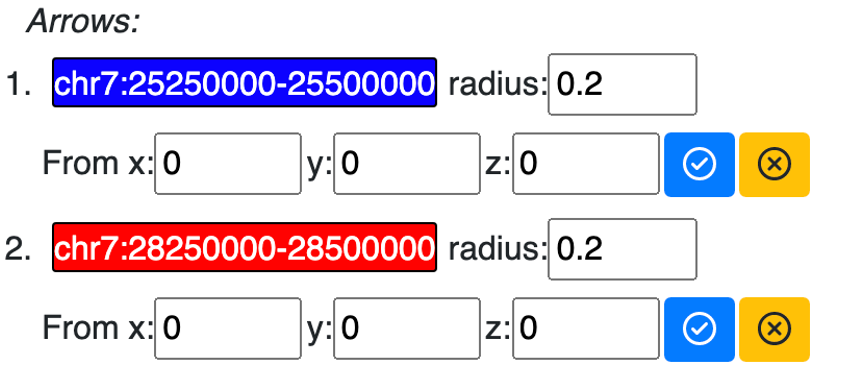
Pointing using arrows
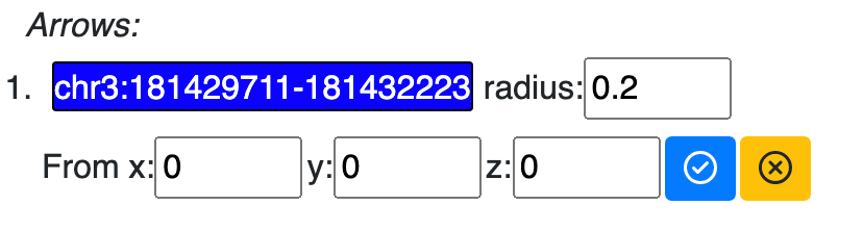
instead of using shapes for labels, arrows can also be used to pointing the region desired. Choose label style as arrow:
use either gene search or region labeling:
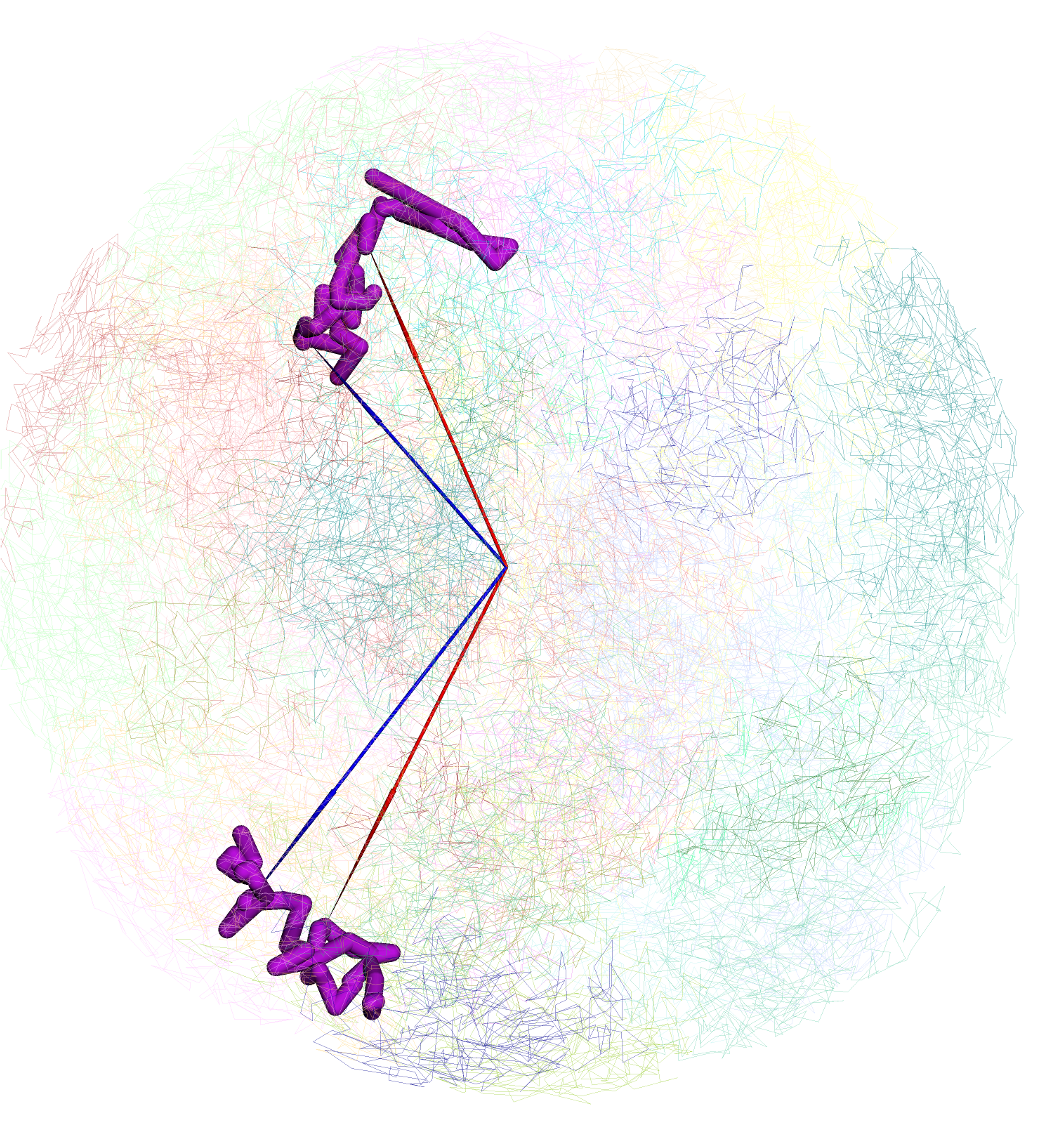
the new added label will be displayed under arrow list:
and displayed in 3d viewer:
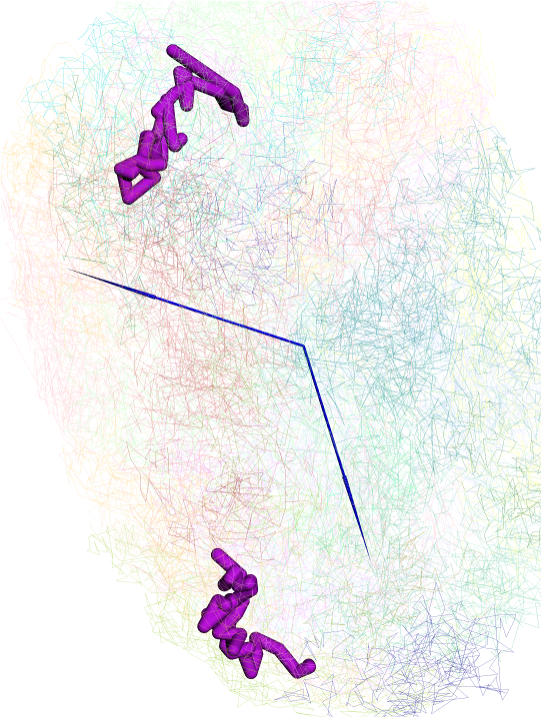
config the style of arrow:
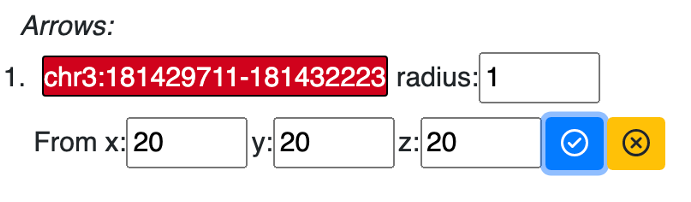
updated arrow style in the viewer:
Interactivity on 3D model
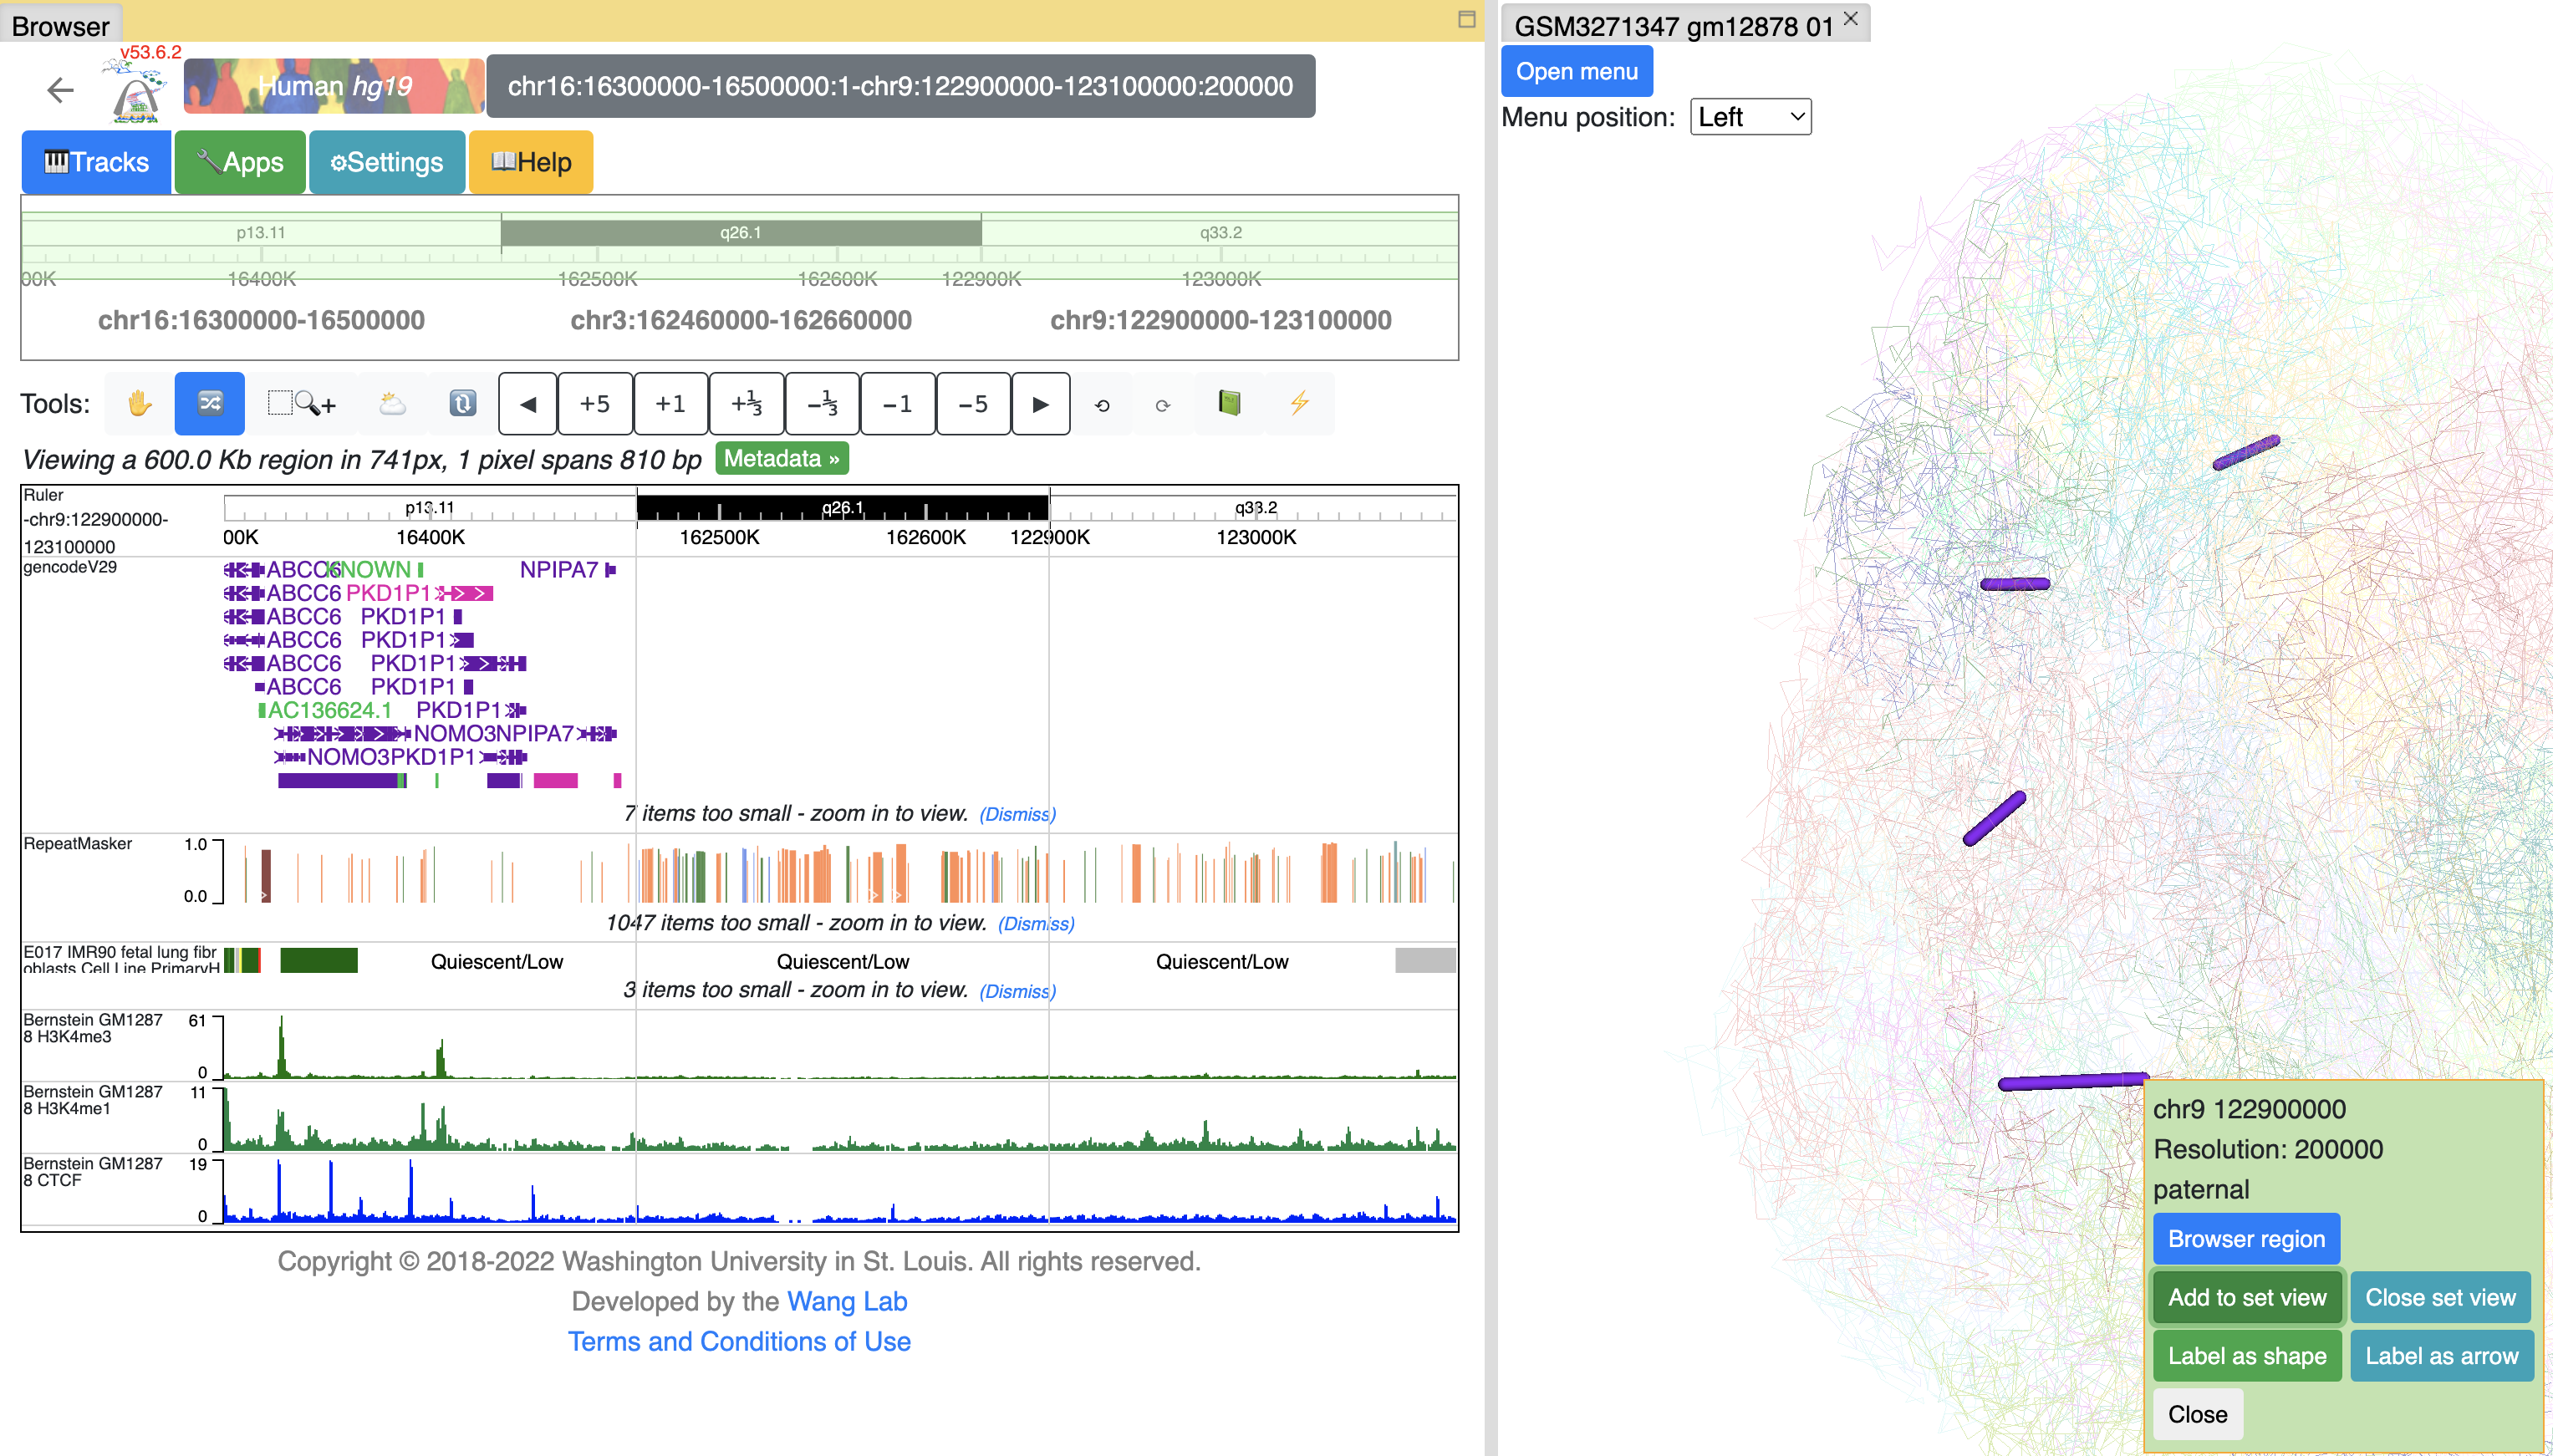
Click on the segments of 3D model will bring up the menu to interact with the Browser:
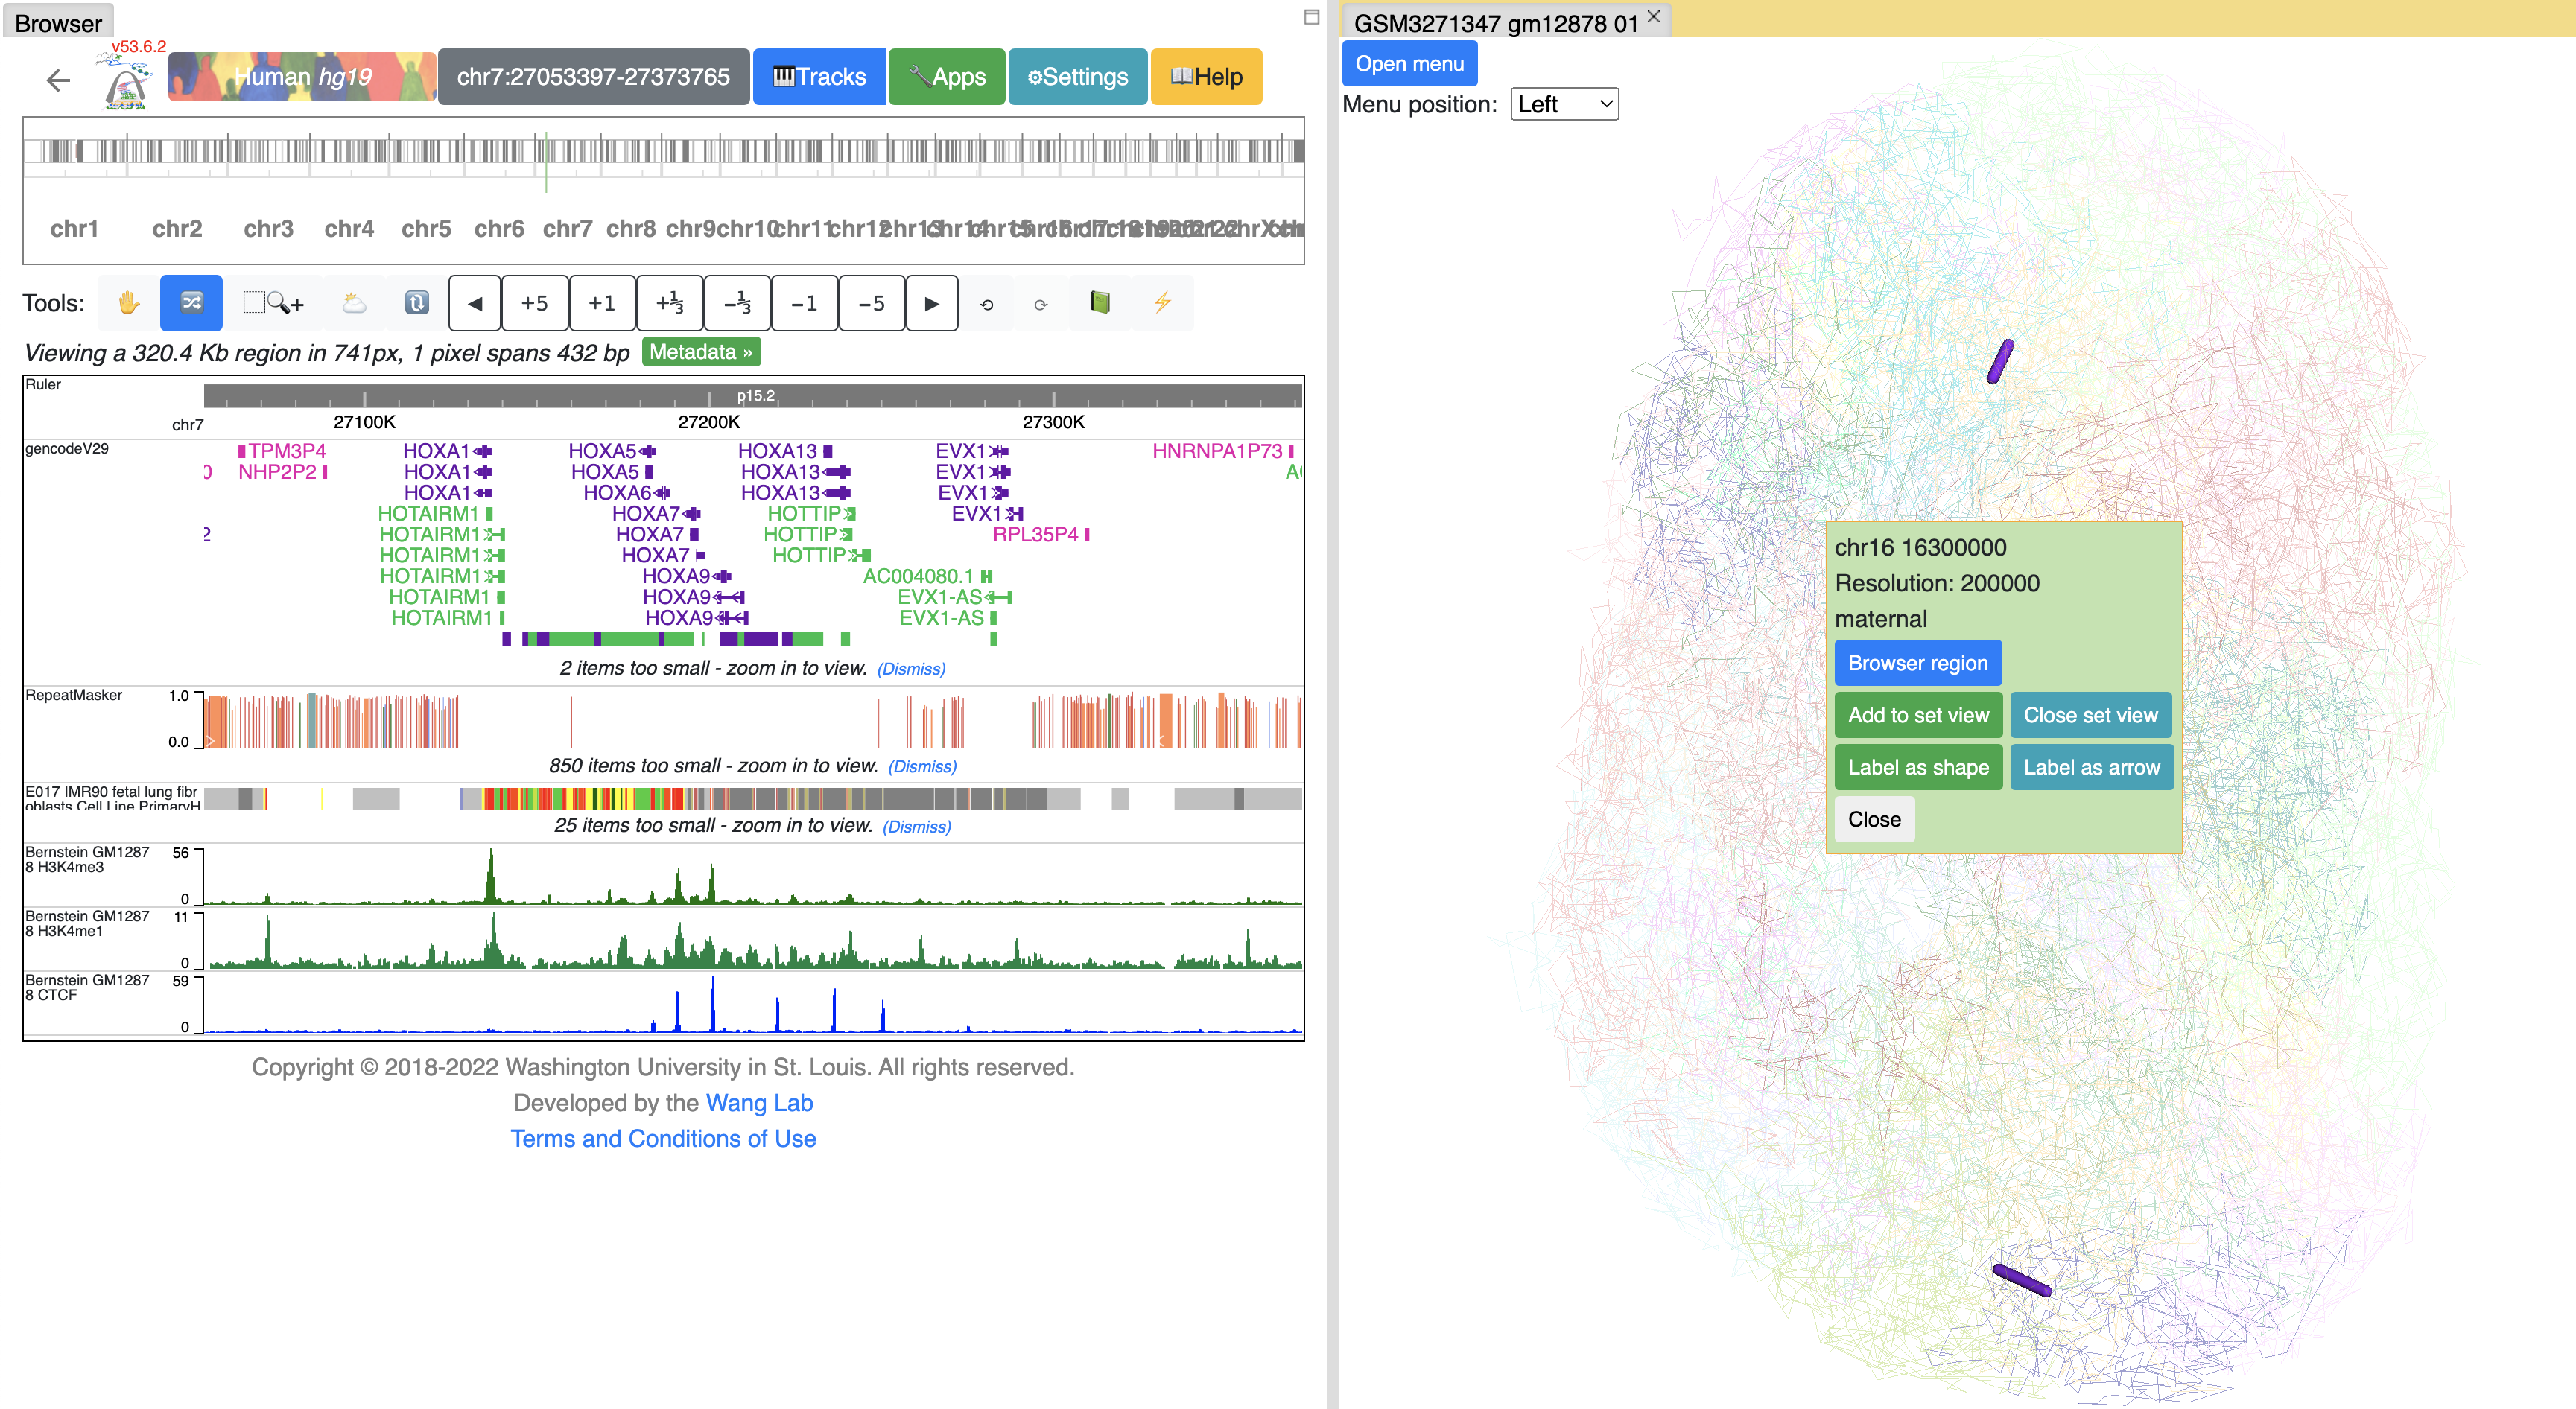
Click Browser region button will let the browser jump to the region of this segment:
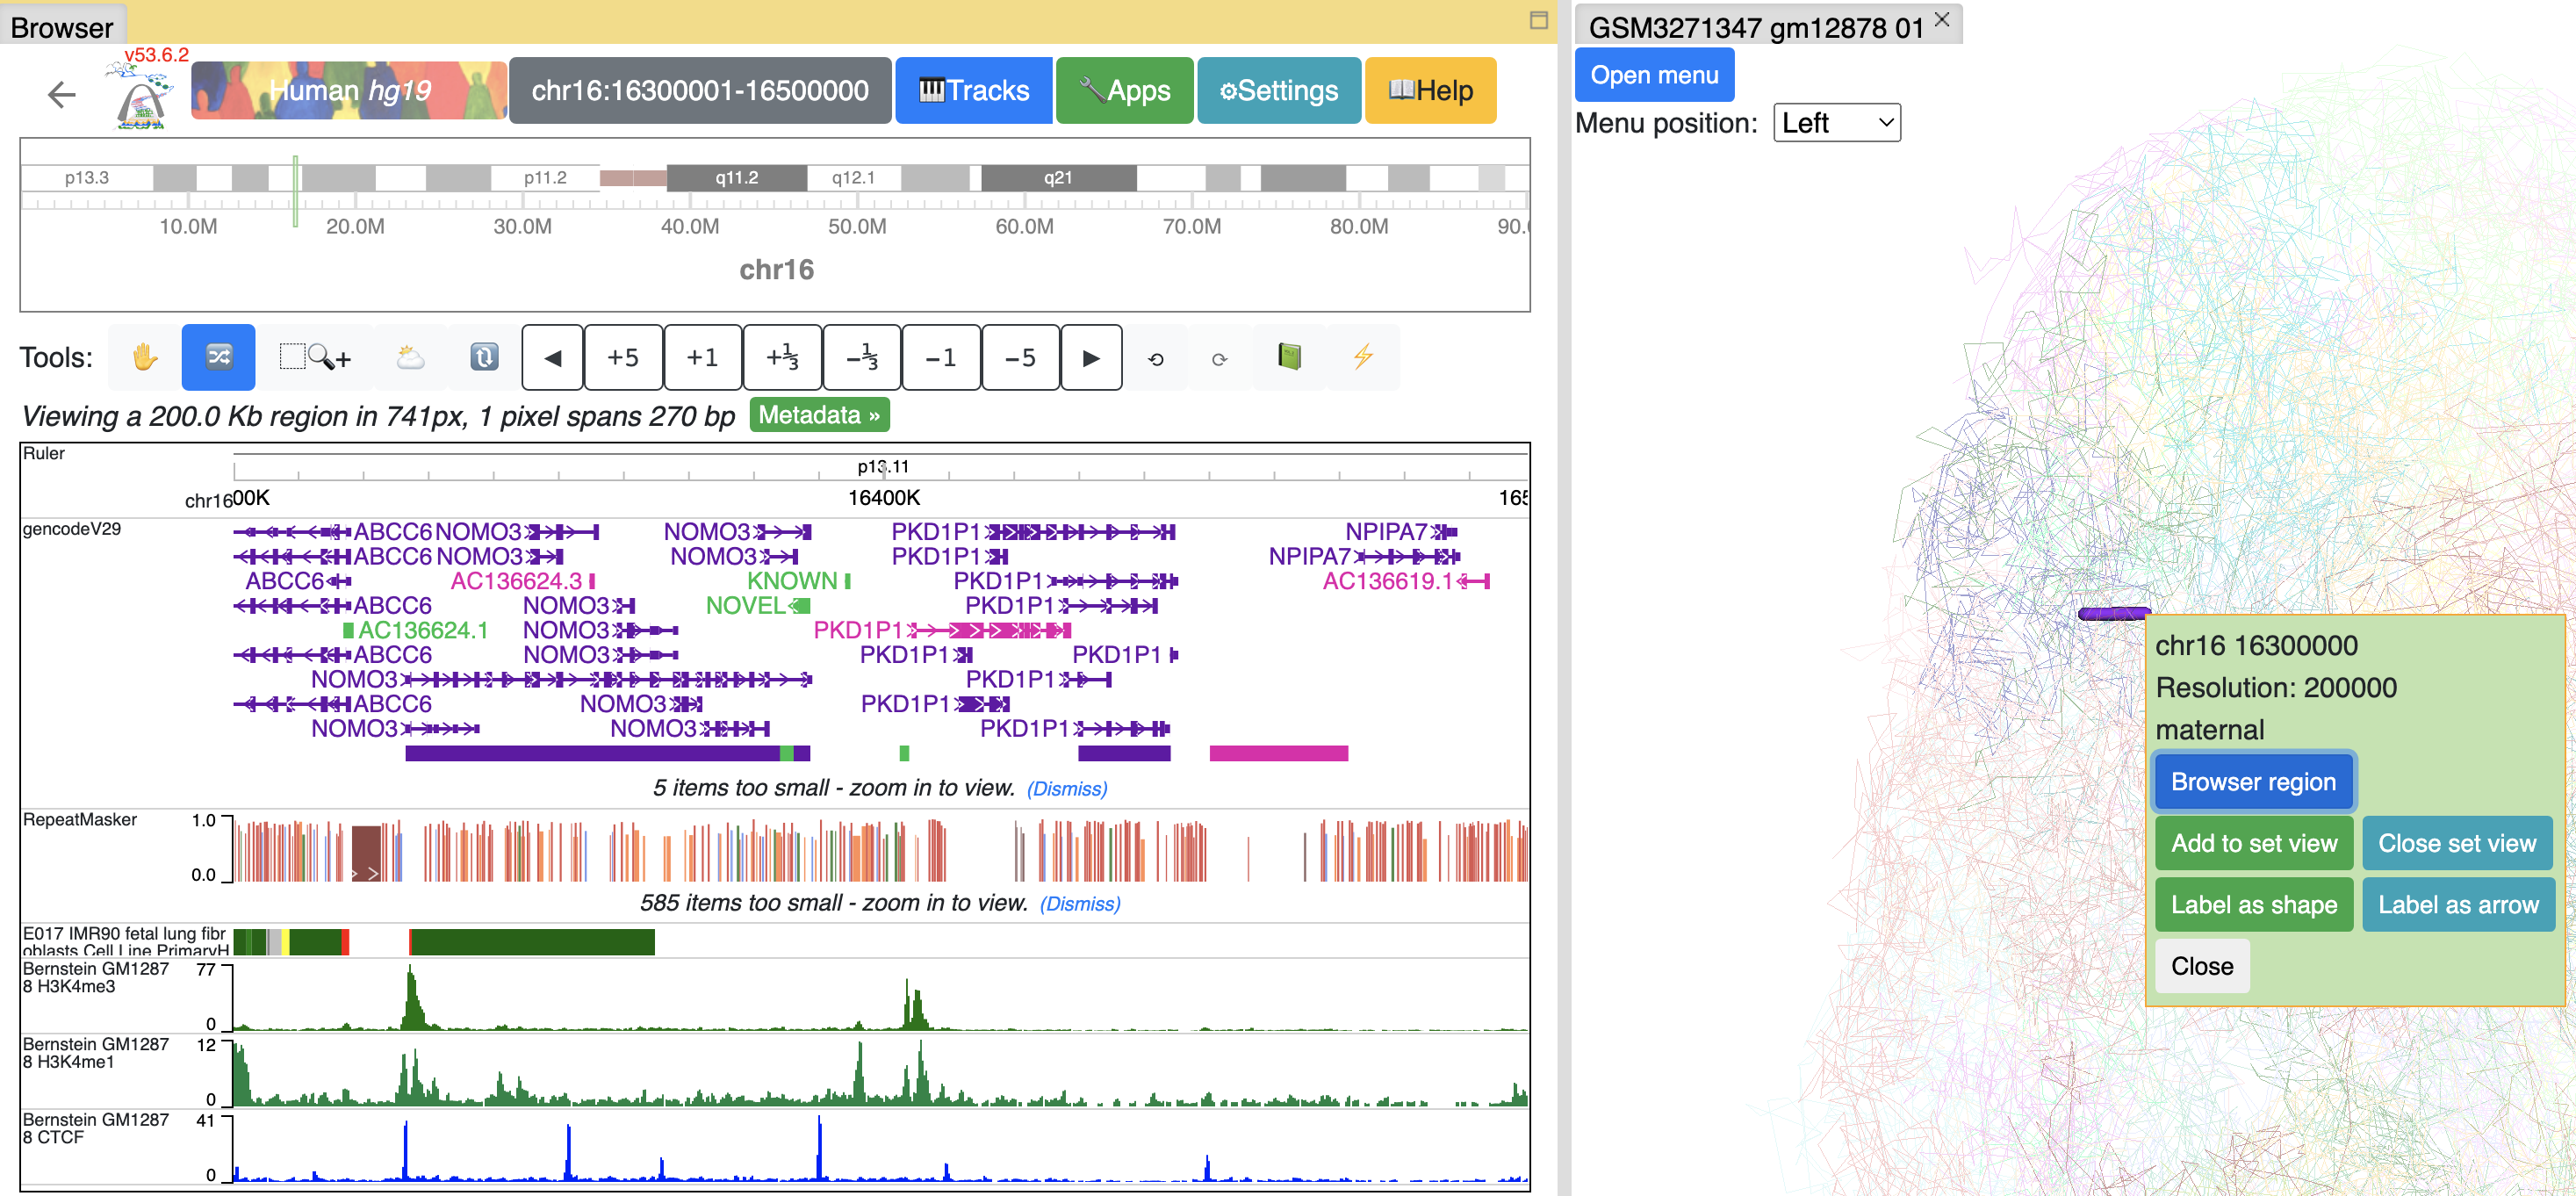
or you can add this segment to current browser reigon by click Add to set view button, the browser will enter Region set view mode:
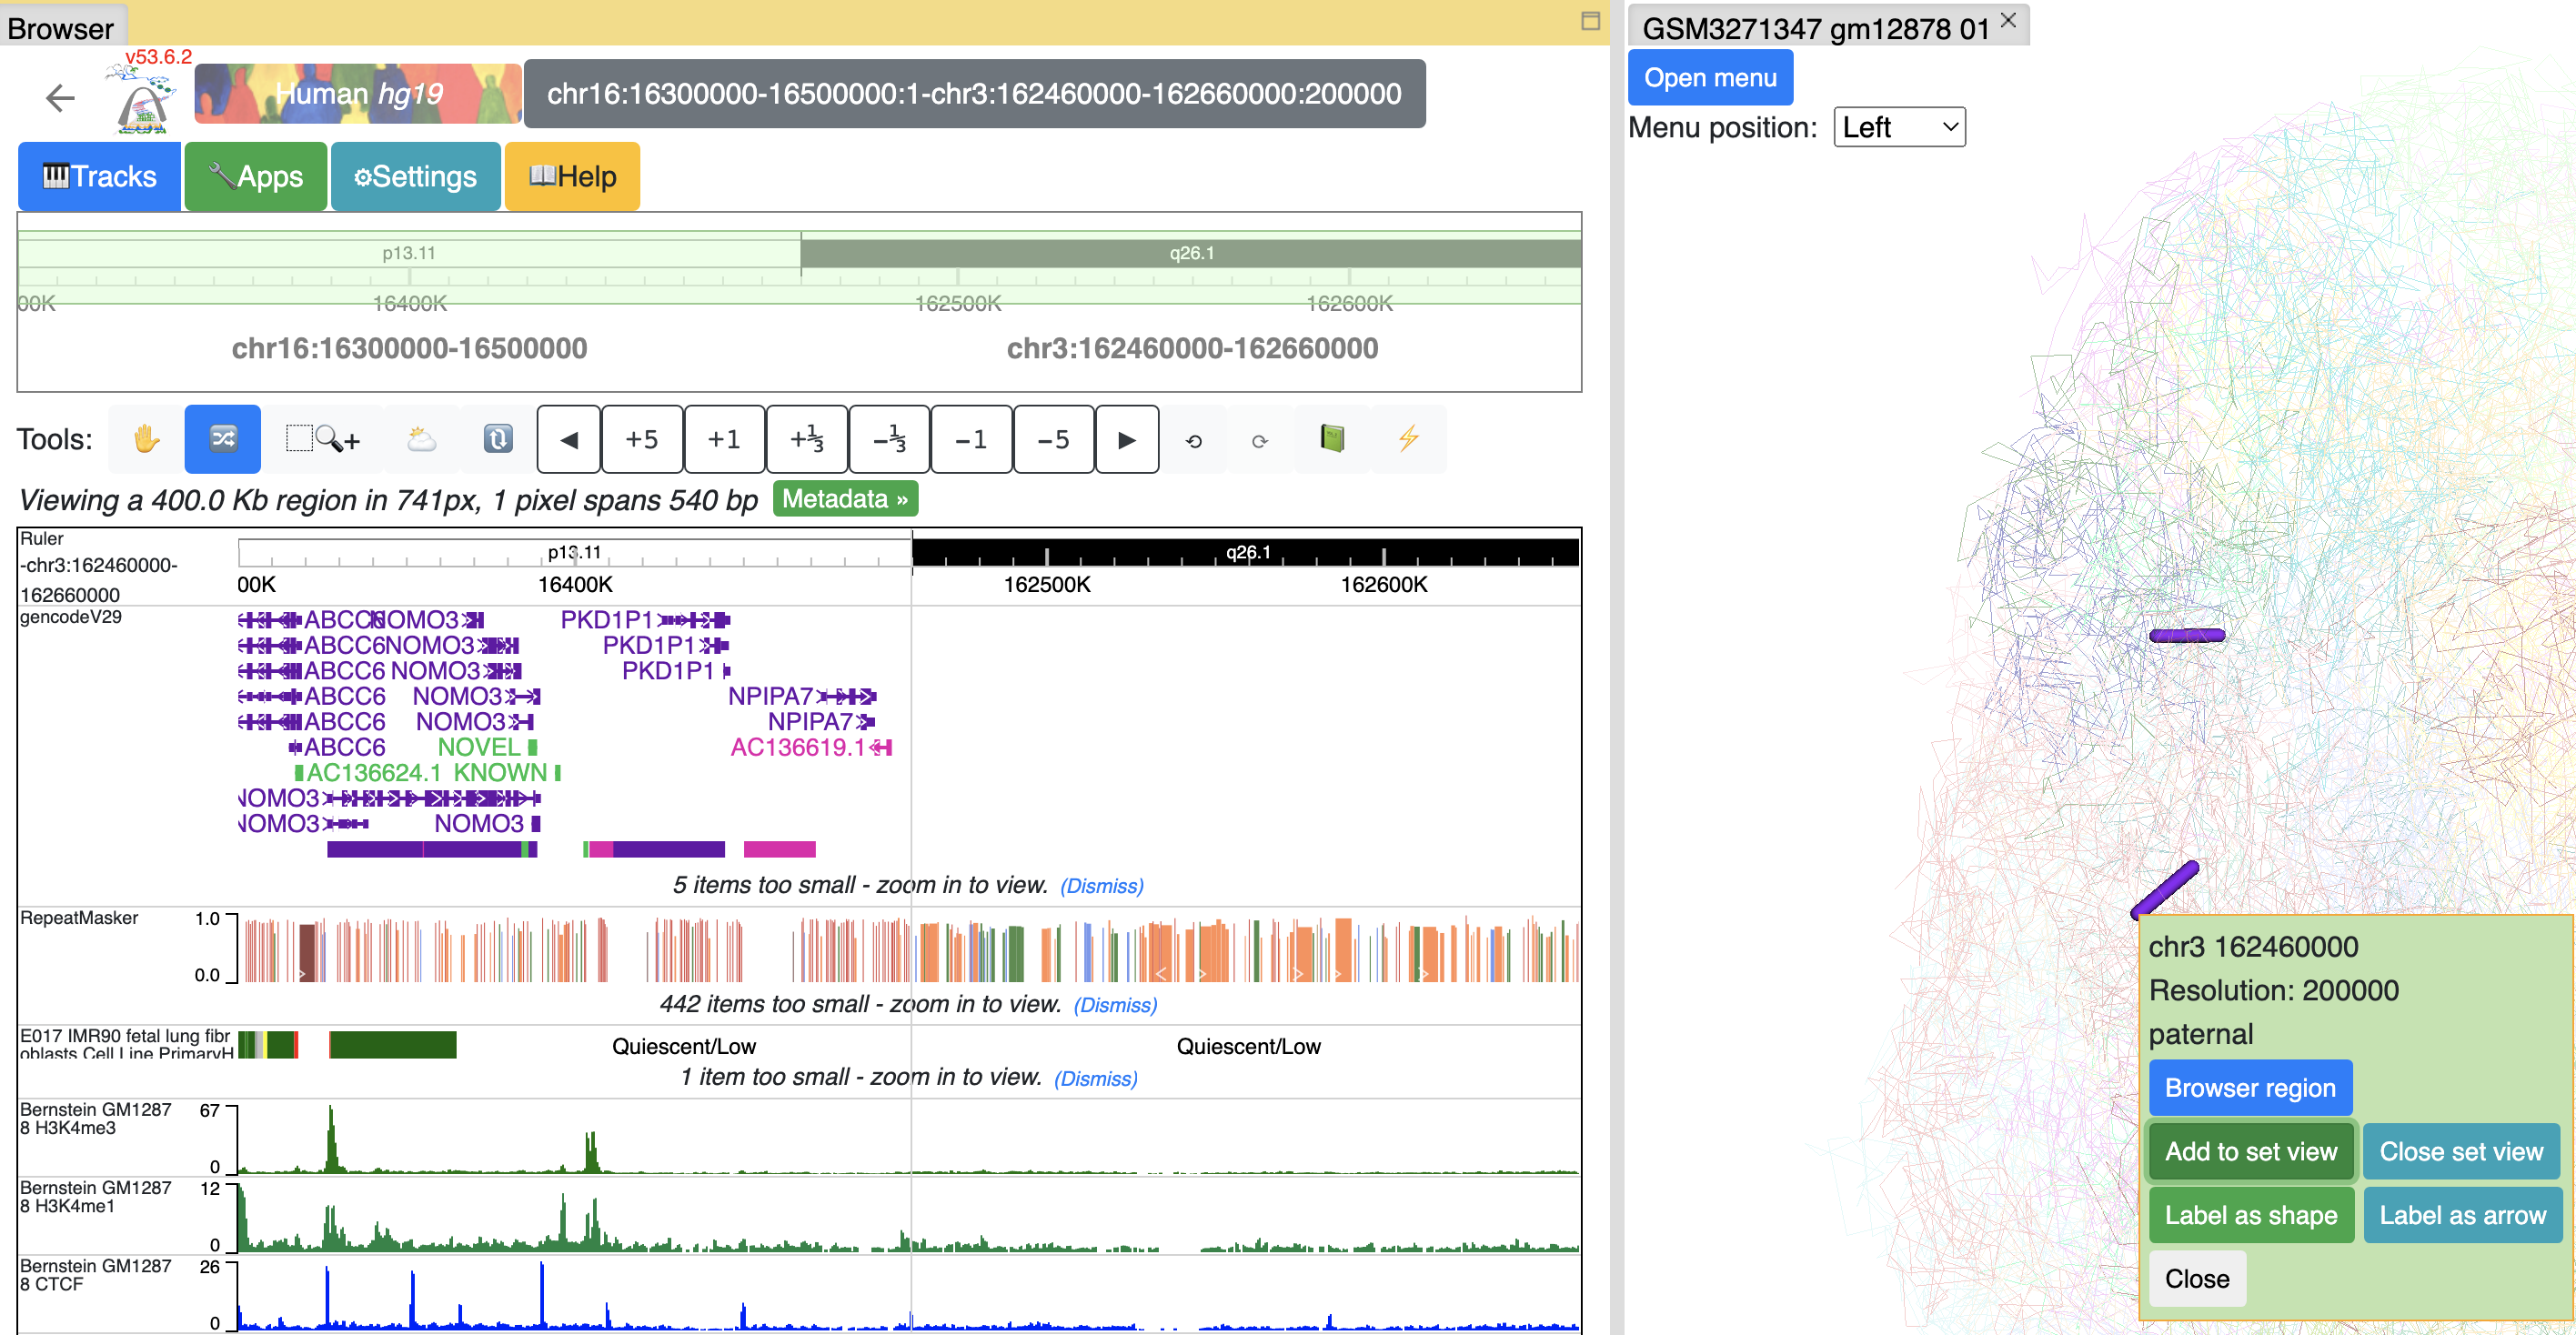
you can keep adding as many segments as you want. Click Close set view button to restore to the default view.
Interactivity on tracks
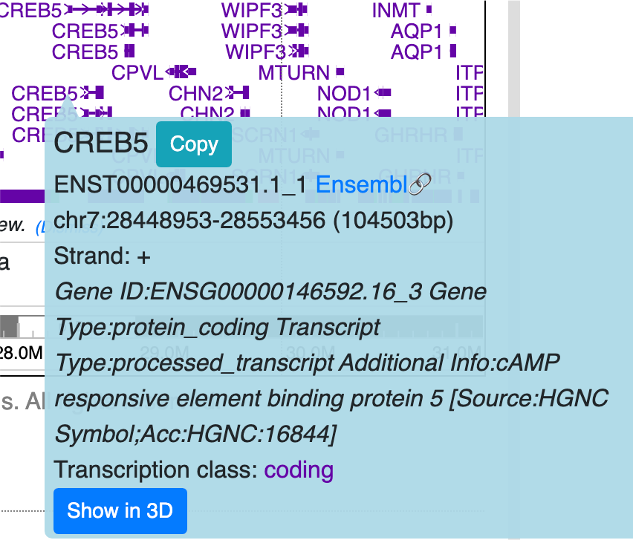
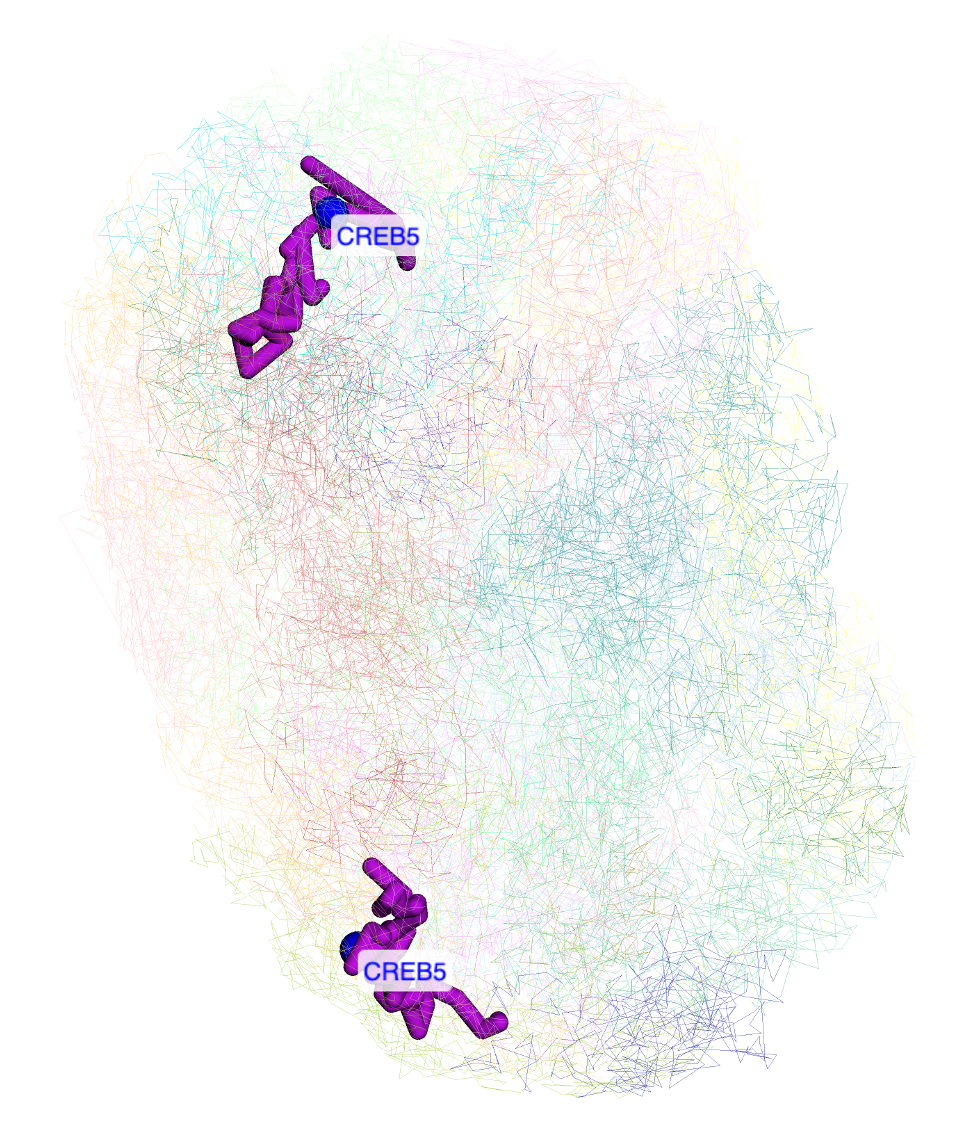
From certain track types like gene and HiC track, users can choose to display gene or HiC anchors on 3D structure directly. As shown below, the tooltip of the gene has Show in 3D button, click it will add this gene to the label list and highlight it in 3D view:
Clicking any dimond on a HiC track will also bring the Show in 3D button, click it will add both anchors of this contact to the arrow list by default:
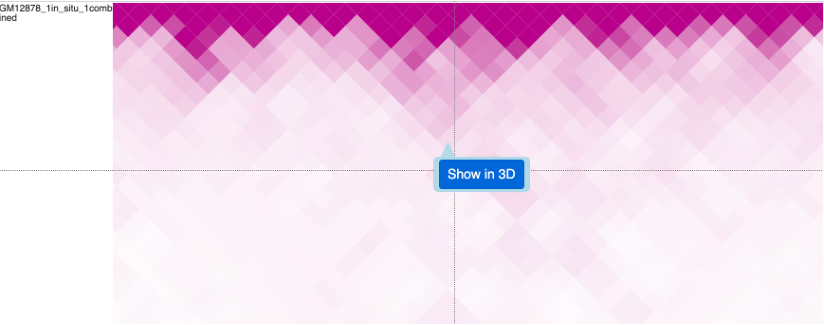
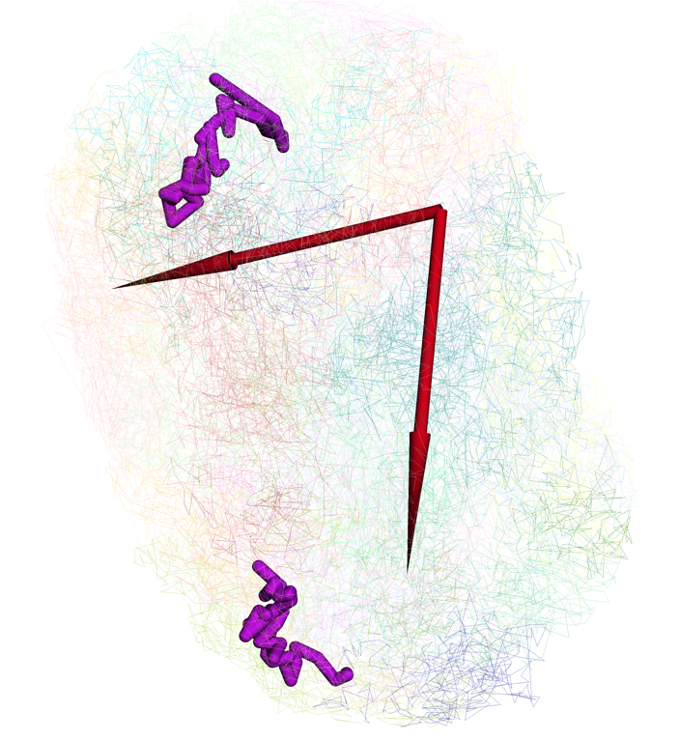
arrows pointing both anchors will be displayed in 3D view (there are 2 models in this structure, patenal and maternal, so 4 arrows displayed here):
Numerical painting
Numerical painting with bigwig data
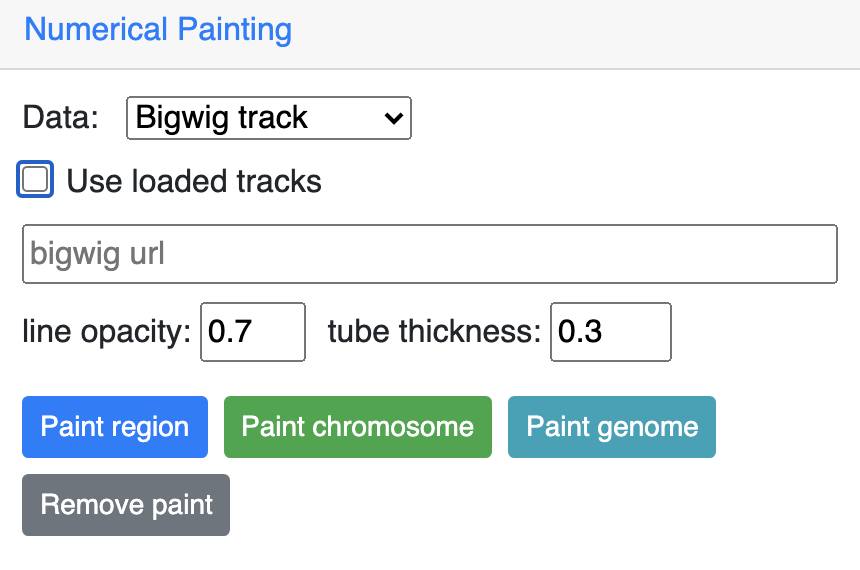
The numerical track in bigWig format can be used to paint the 3D structure. The Use loaded tracks check menu allows user to load either loaded bigWig tracks in browser or submit another bigWig track with file URL.
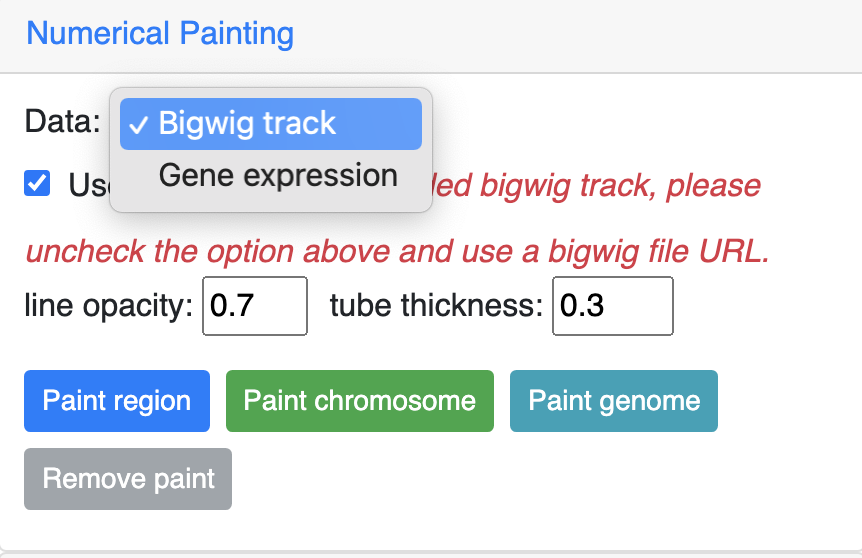
If uncheck Use loaded tracks, a URL input will be provided for bigWig URL input:
Here we are using the GC percentage data of hg38 genome as example, add the GC Percent track from Annotation Tracks:
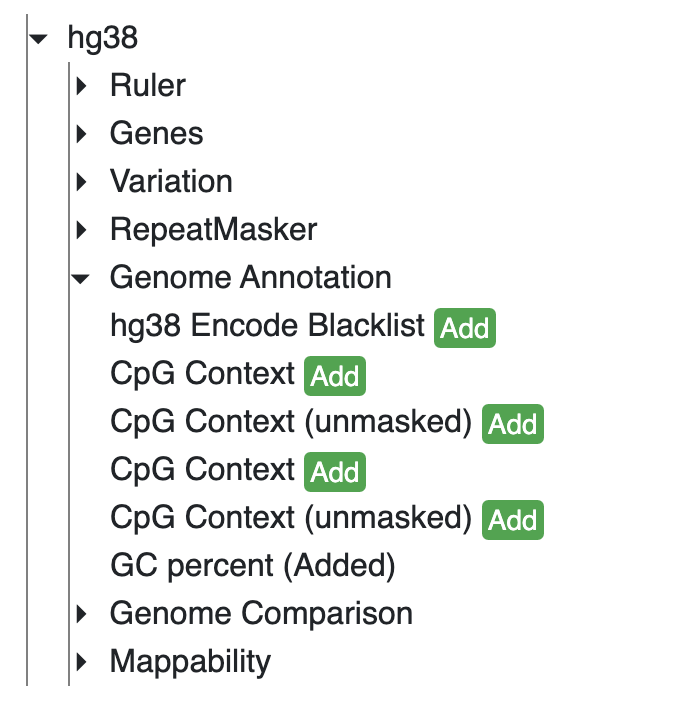
The GC Percent track is added:
Choose the track from the dropdown menu:
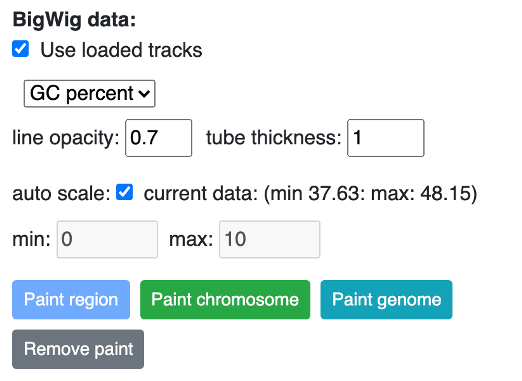
Click Paint region button:
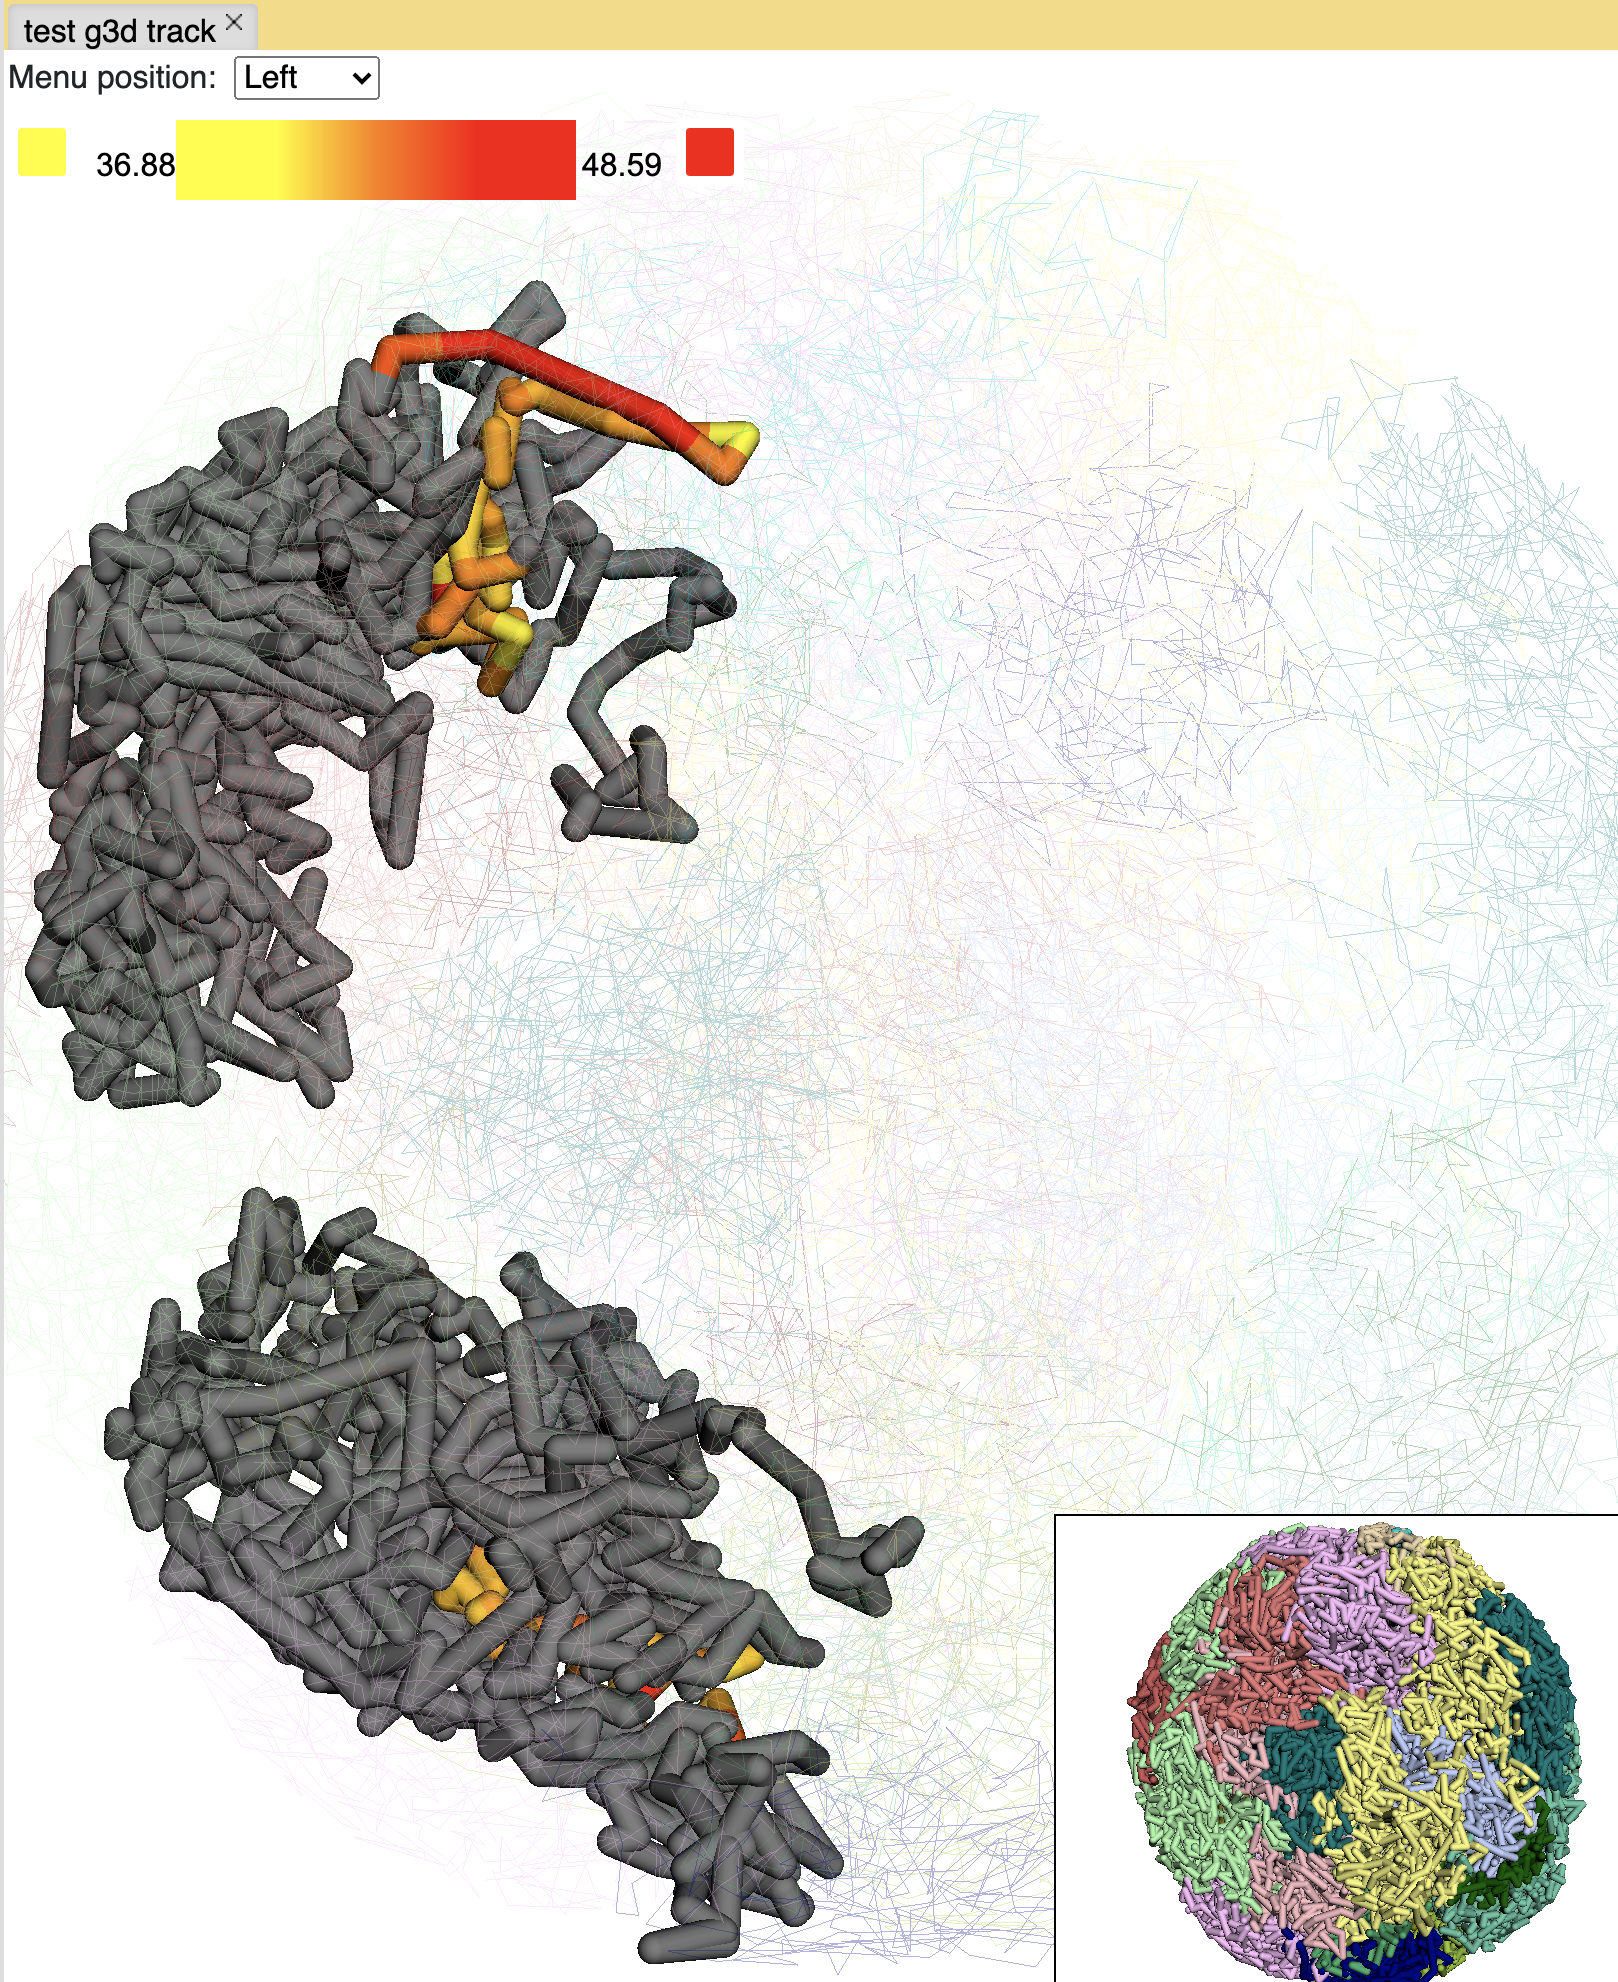
you can also paint the whole chromosome by click the Paint chromosome button:
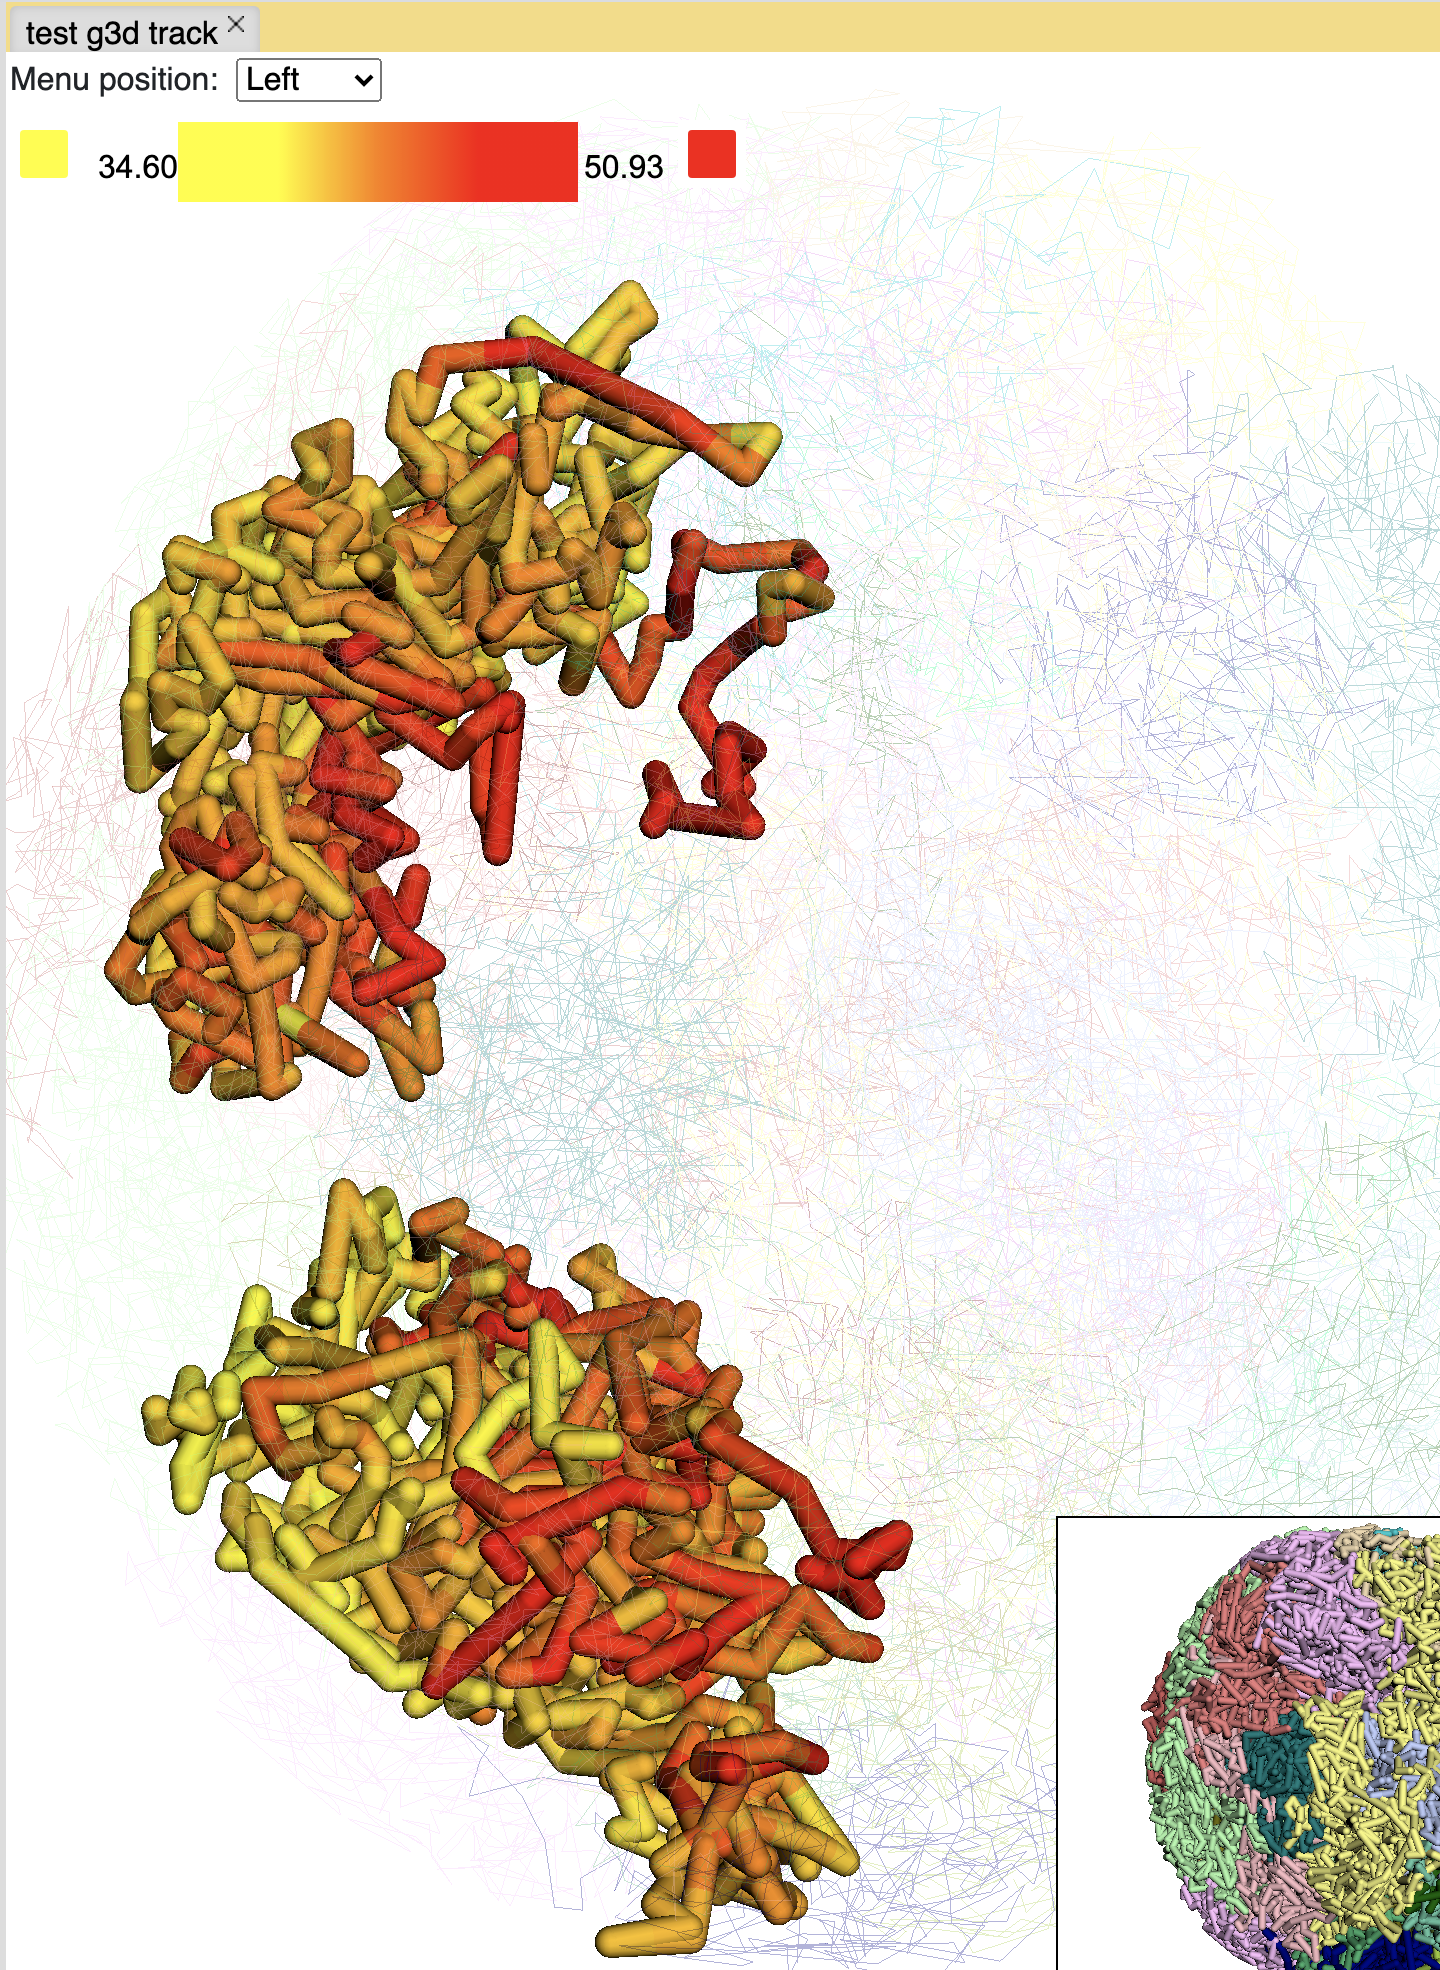
Click the color box on the color legend will bring a color palette for choosing colors:
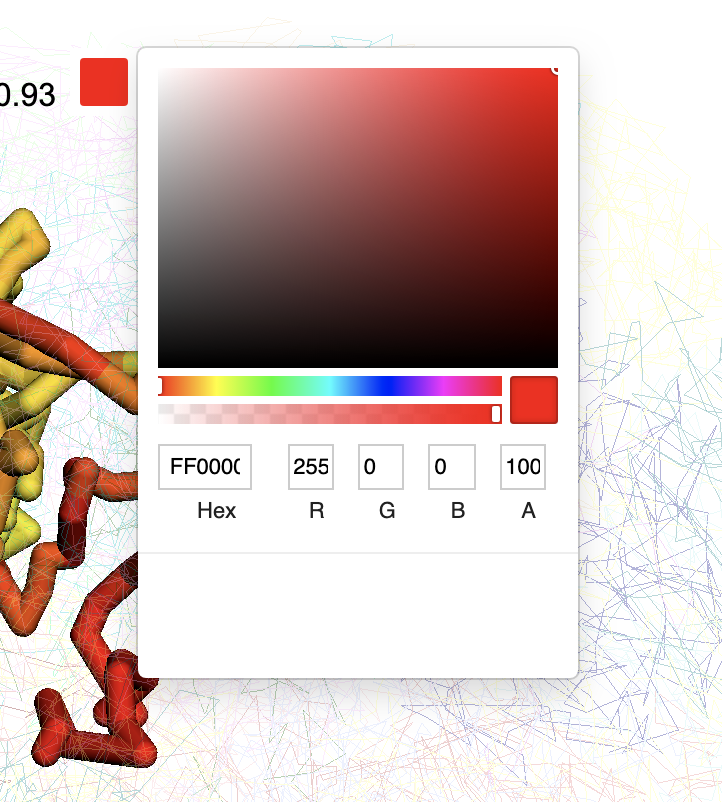
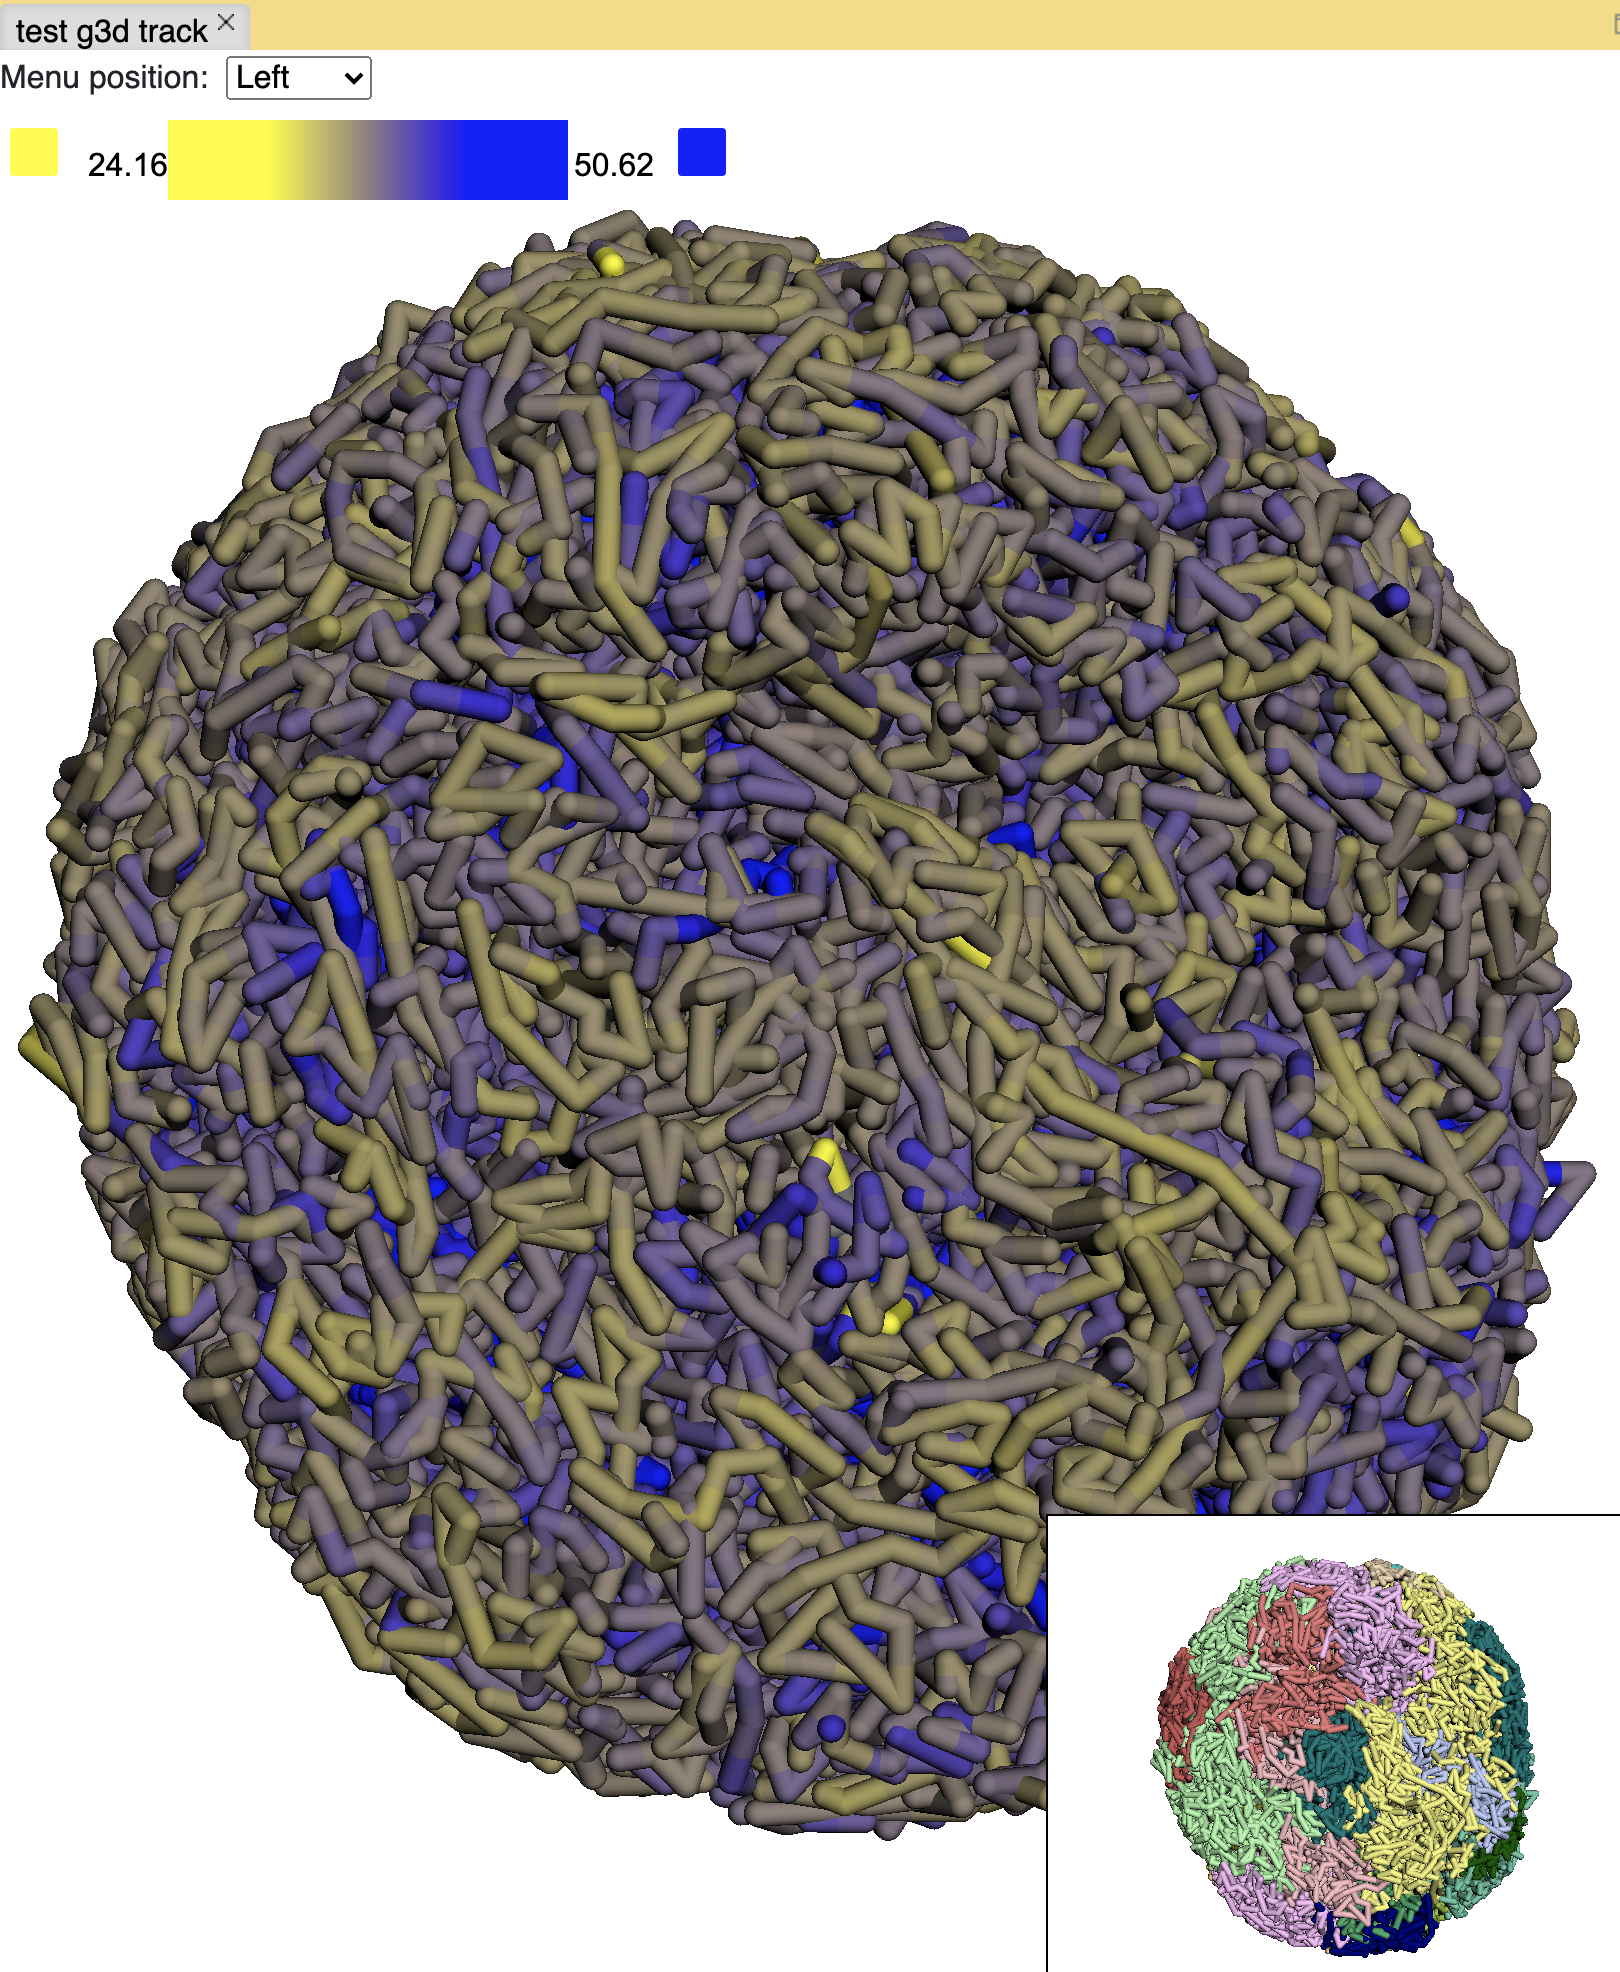
Choose a different color will rerender the structure with color chosen:
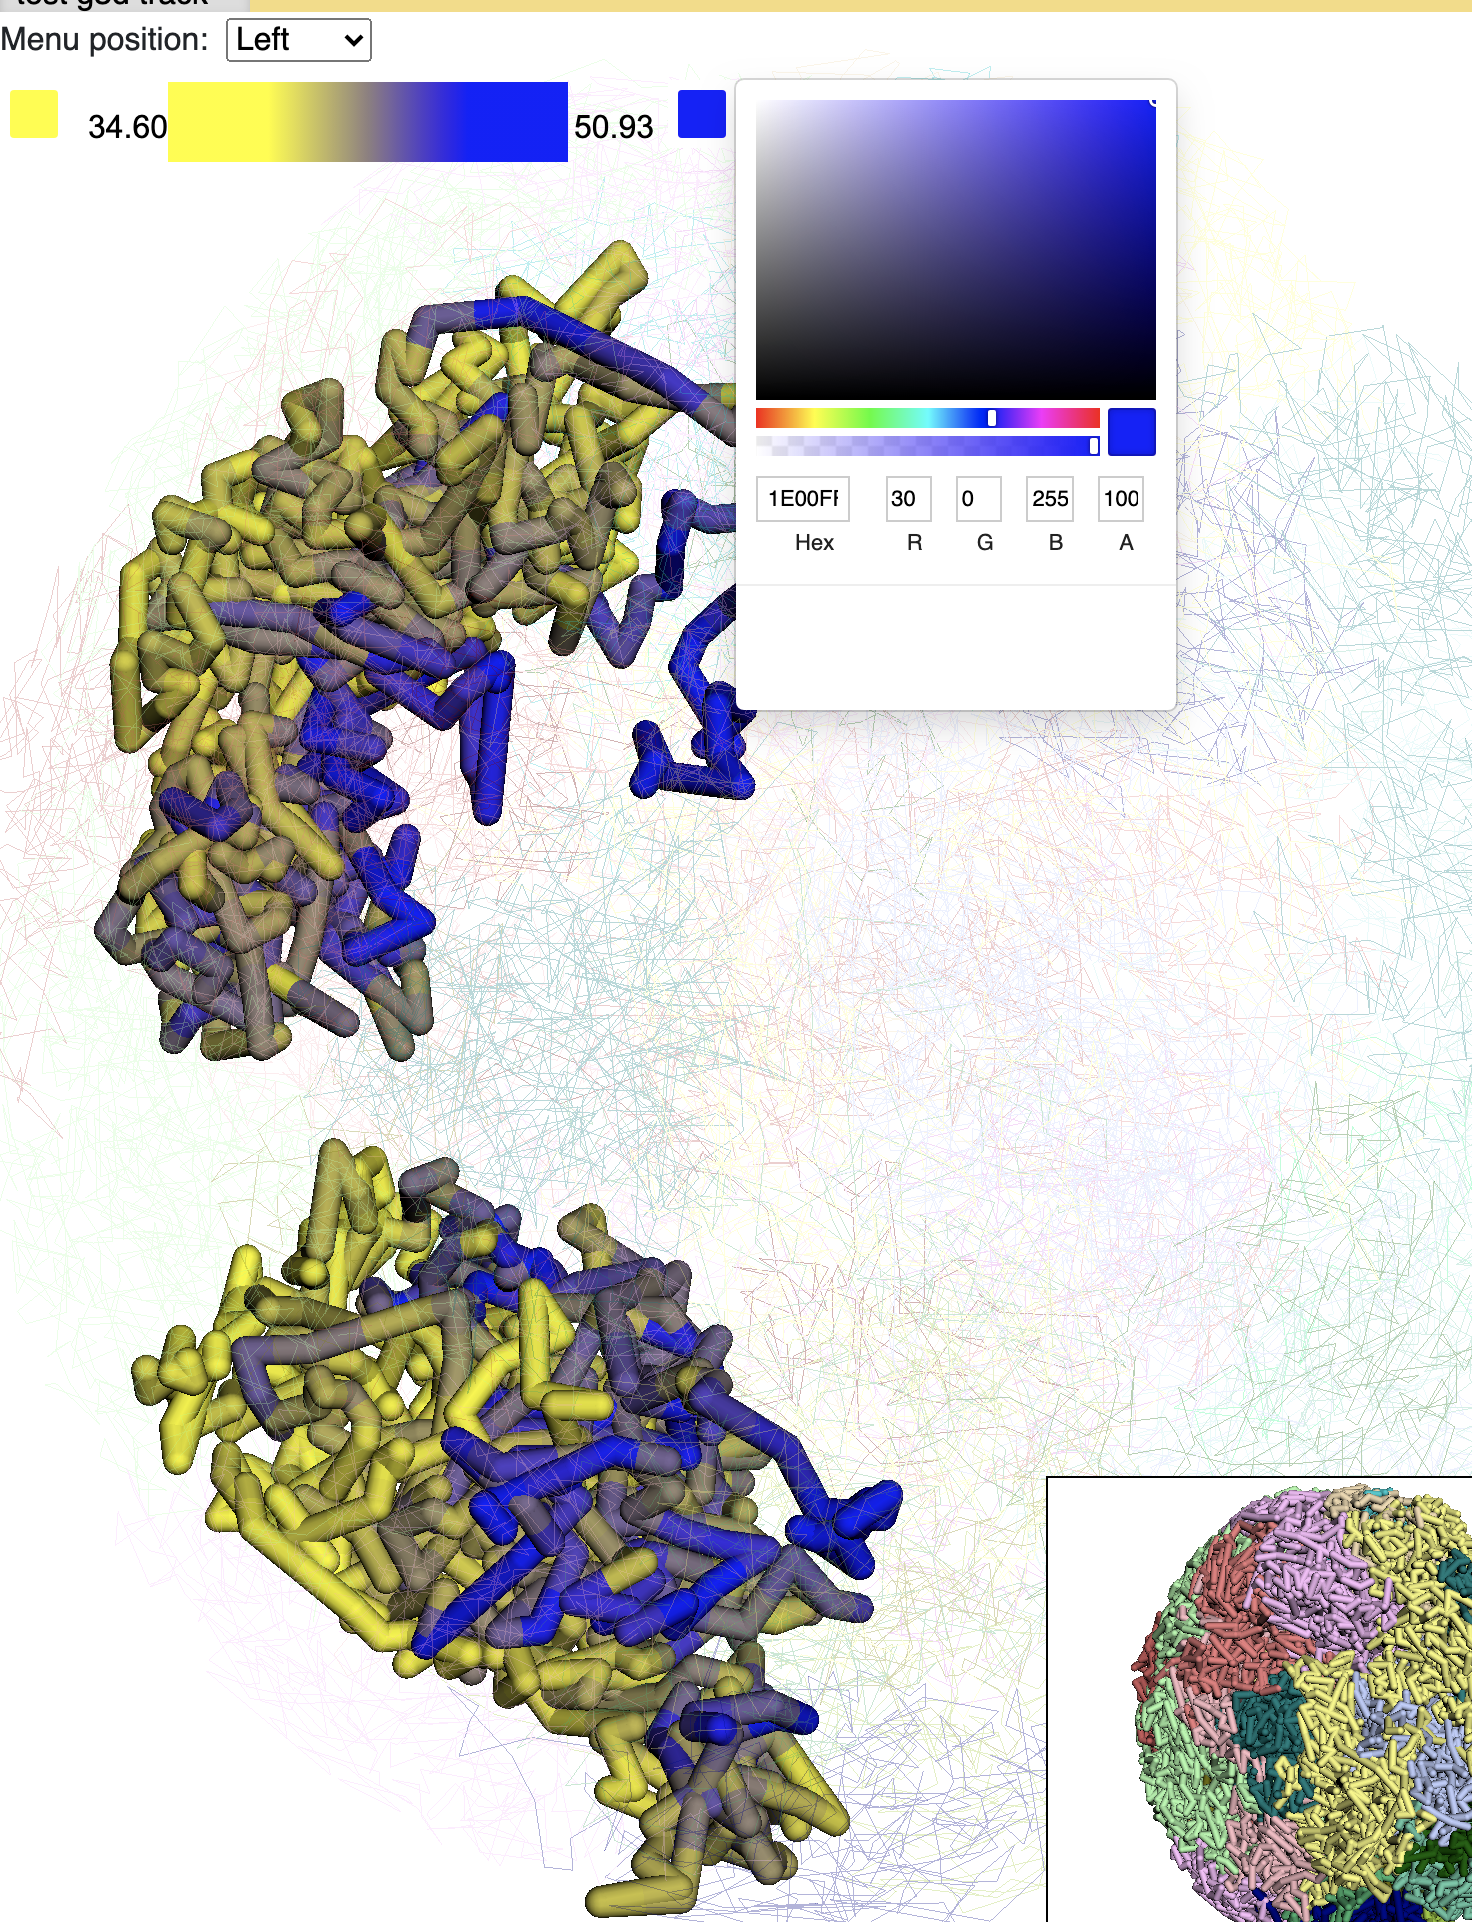
Paint the whole genome is also doable, click the Paint genome button:
Note
by default the color gradient uses the min and max values from the bigwig file, users can also set the min and max value manually by unchecking the auto scale option.
Click the Remove paint button will remove the painting.
Numerical painting with gene expression data
For painting with gene expression data, the data need be organized in the following format:
chr3        168903366       168921996       ENSG00000242268.2       2.40146671319
chr18       46756487        46764408        ENSG00000270112.3       0.0287250976522
chr3        11900011        11901245        ENSG00000225275.4       0.0
chr15       41921417        41928883        ENSG00000259883.1       0.305029986379
chr13       98949719        98950447        ENSG00000231981.3       0.0806509326125
chrX        152682810       152683842       ENSG00000269475.2       0.0
chr12       44880868        44880969        ENSG00000201788.1       0.0
chr17       57092145        57096425        ENSG00000263089.1       0.295277363304
This is a 5 column bed format file, each column is chromosome, start, end, gene id or symbol, gene expression value (can be FPKM, RPKM or whatever types of value you want to plot).
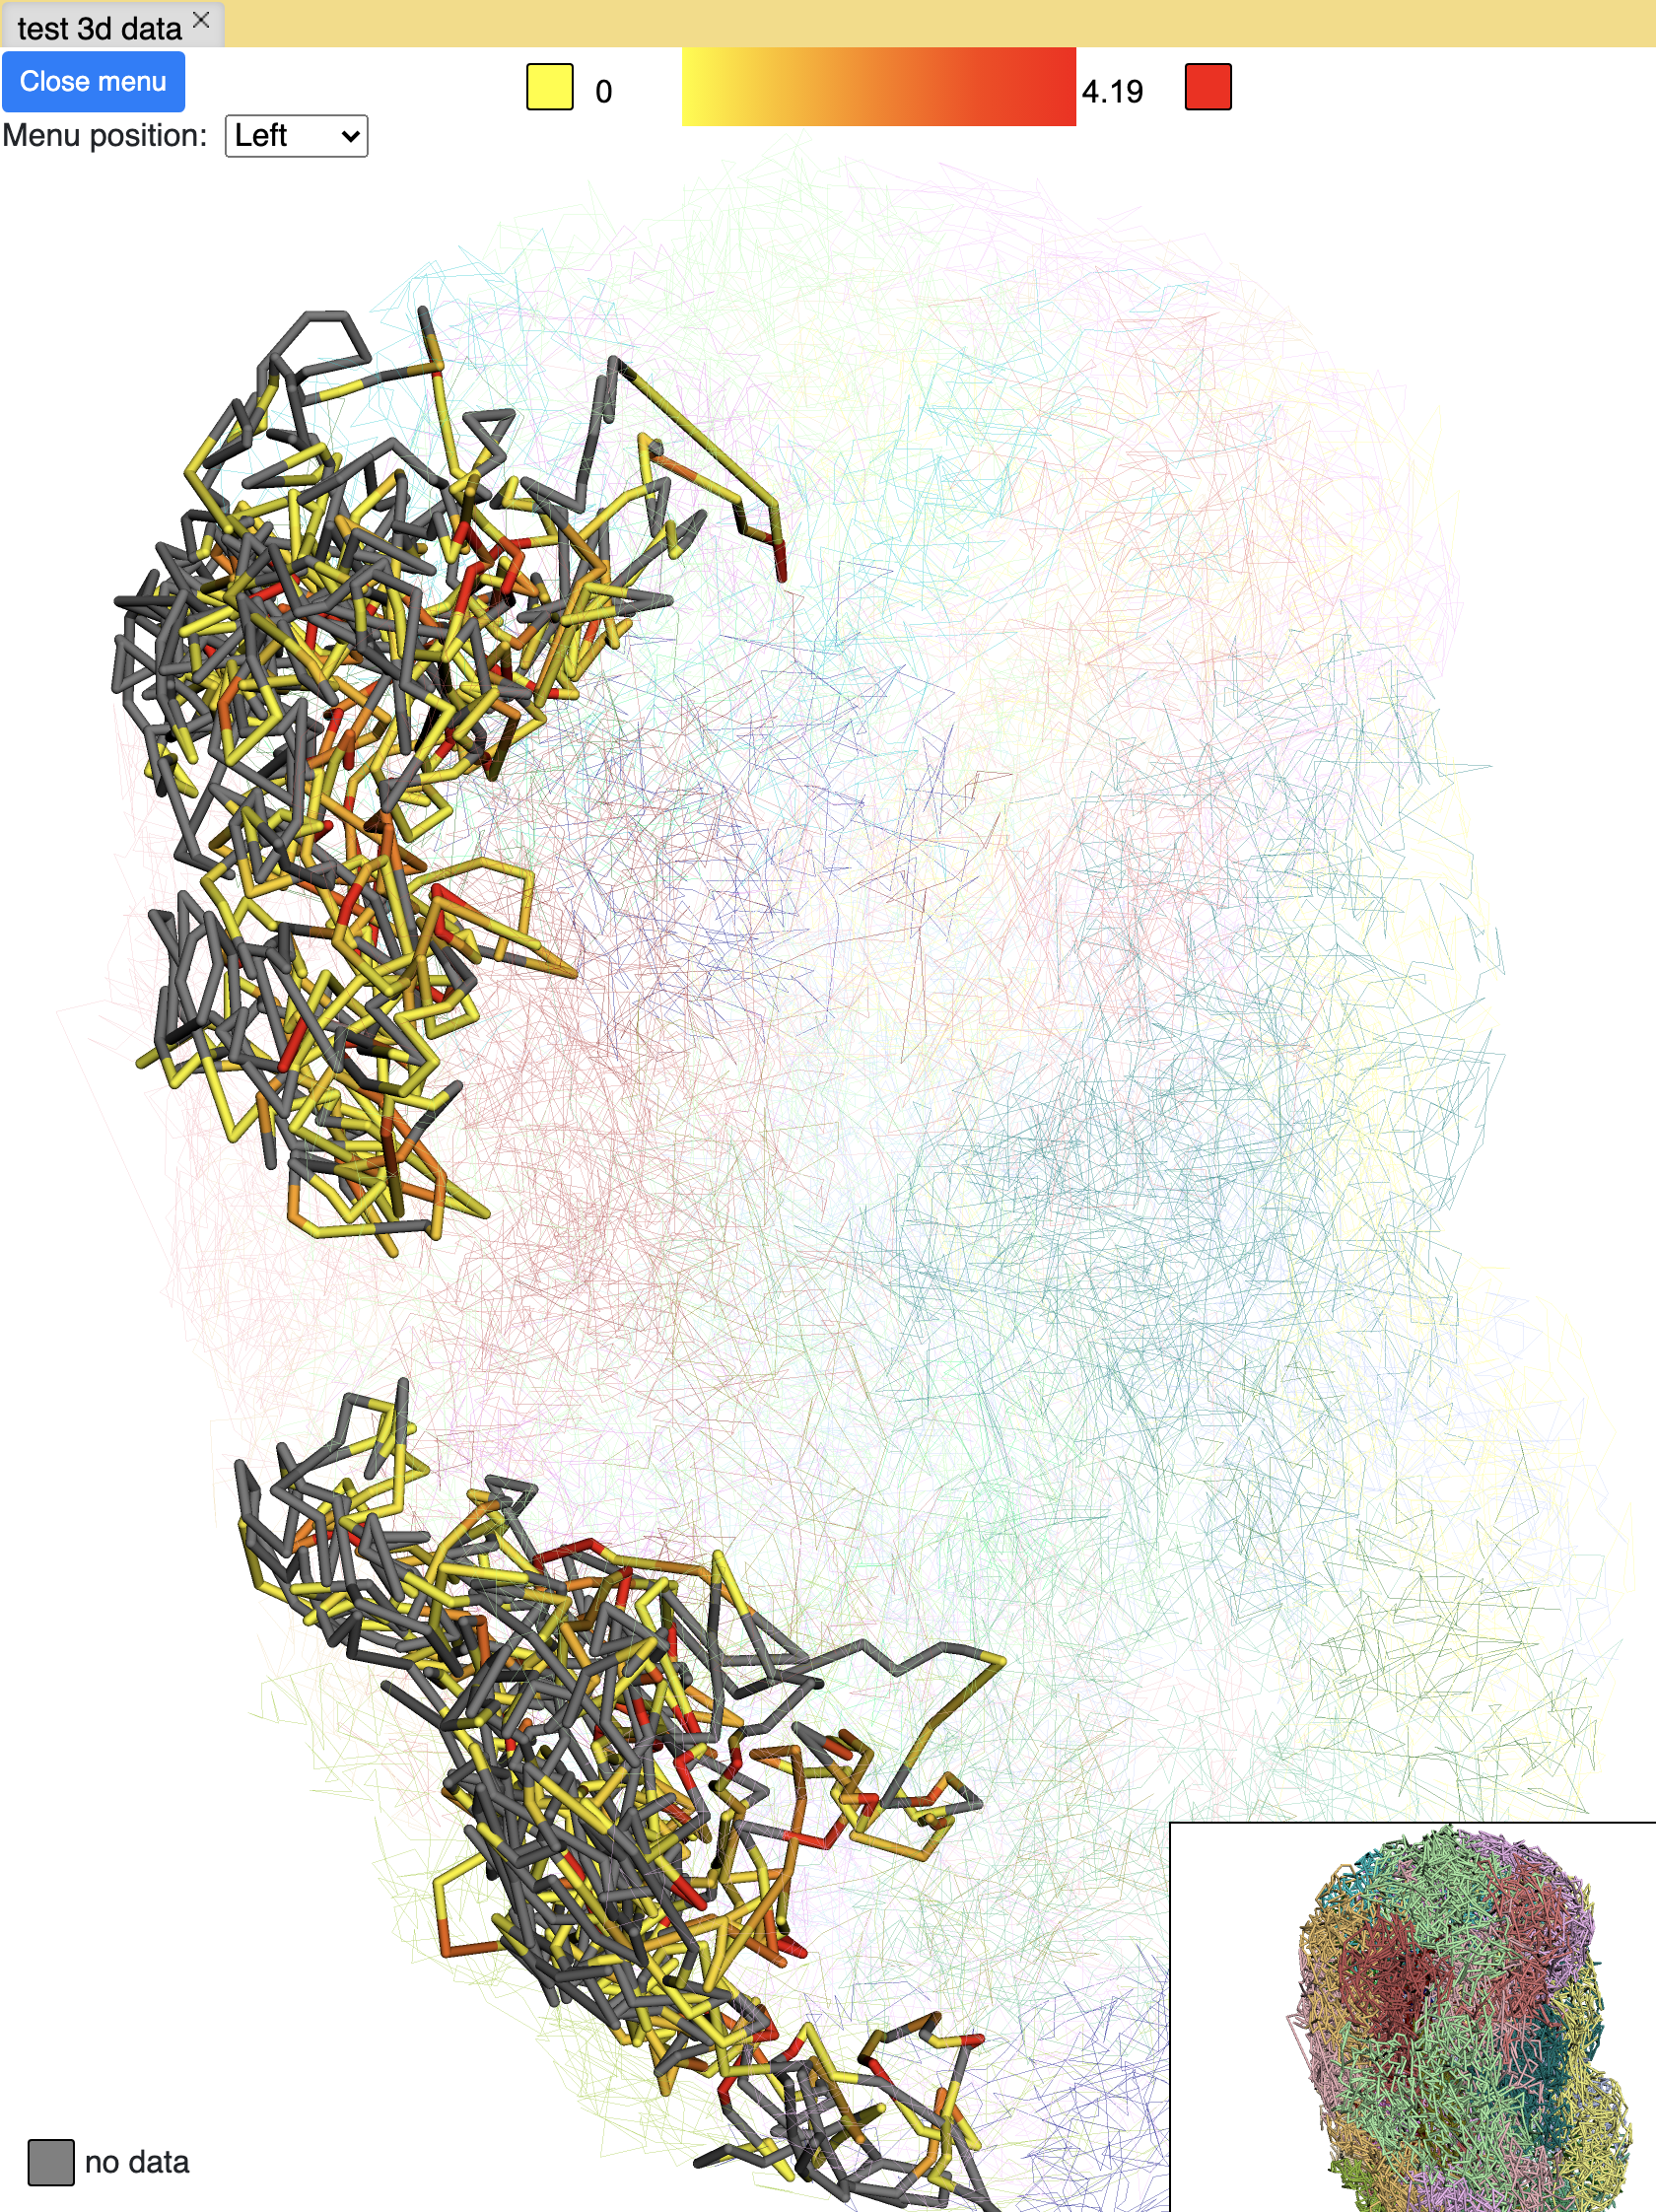
Choose Gene expression from the dropdown menu, then upload your file, click one the paint button.
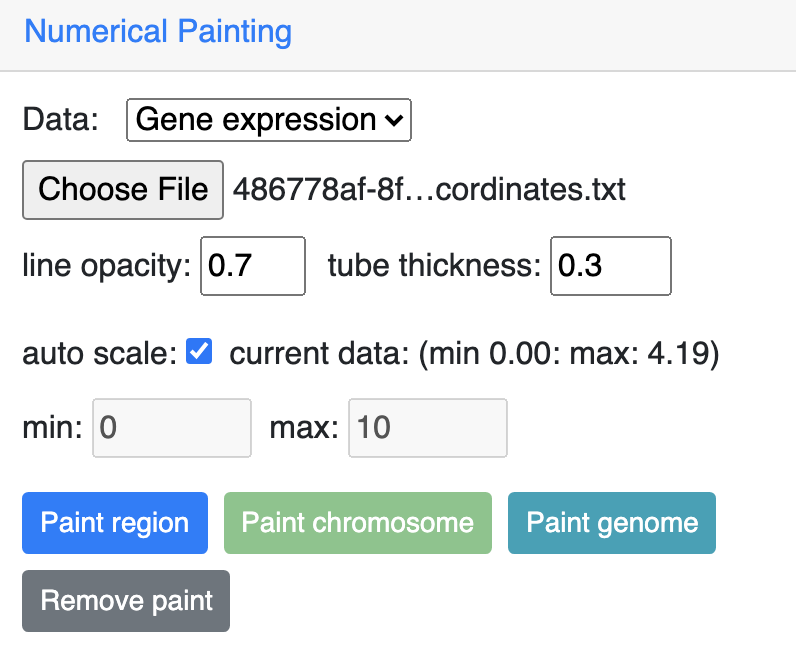
And this is the view after painting with the expresion data, color and scale can be customized as described before:
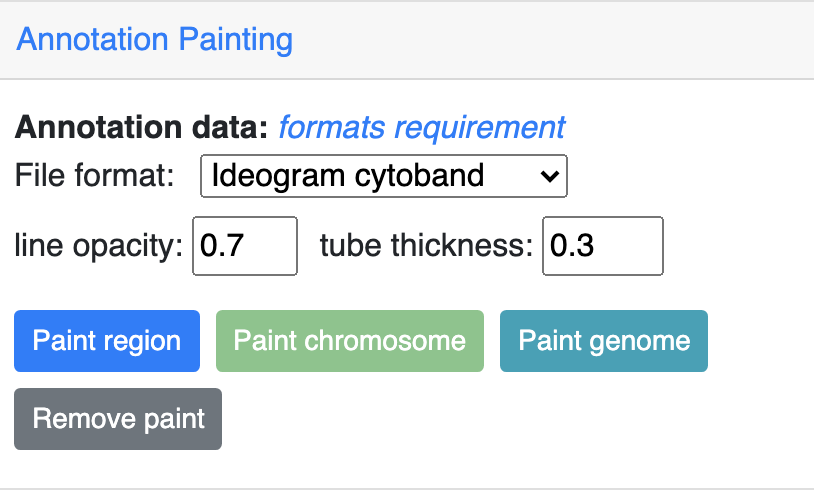
Annotation painting
Supported file formats for 3D annotation painting
cytoband
For cytoband there is no need to upload a file, the cytoband data will be read from current loaded genome data.
refGene
The standard refGene format from UCSC can be used for painting gene positions on 3D:
2085        NR_046630       chr3    +       196666747       196669405       196669405       196669405       3       196666747,196667841,196669263,  196666995,196668013,196669405,  0       NCBP2-AS1       unk     unk     -1,-1,-1,
2051        NR_046598       chr3    +       192232810       192234362       192234362       192234362       2       192232810,192234269,    192233297,192234362,    0       FGF12-AS2       unk     unk     -1,-1,
1312        NR_046514       chr13   +       95364969        95368199        95368199        95368199        2       95364969,95365891,      95365647,95368199,      0       SOX21-AS1       unk     unk     -1,-1,
585 NR_106918       chr1    -       17368   17436   17436   17436   1       17368,  17436,  0       MIR6859-1       unk     unk     -1,
585 NR_107062       chr1    -       17368   17436   17436   17436   1       17368,  17436,  0       MIR6859-2       unk     unk     -1,
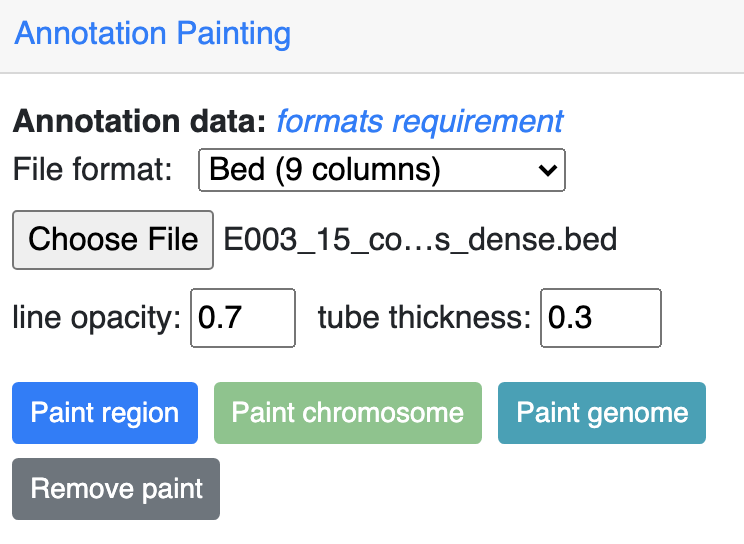
bed 9 columns
bed file with 9th column as RGB values can be used as well, for example, the chromHMM from Roadmap project looks like:
chr10       0       94800   15_Quies        0       .       0       94800   255,255,255
chr10       94800   95600   9_Het   0       .       94800   95600   138,145,208
chr10       95600   102200  15_Quies        0       .       95600   102200  255,255,255
chr10       102200  104400  9_Het   0       .       102200  104400  138,145,208
chr10       104400  110000  15_Quies        0       .       104400  110000  255,255,255
chr10       110000  111200  9_Het   0       .       110000  111200  138,145,208
bed 4 columns
To make things simple, a 4 column bed format is supported as well, with the 4th column has color value:
chr11       108280000       109080000       #ff0100
chr11       109080000       109480000       #0000ff
chr11       109720000       110160000       #018100
chr11       110200000       111400000       #0064fb
chr11       111400000       112640000       #ef8c0a
chr11       112640000       113480000       #7f007f
chr11       113520000       114520000       #520000
chr11       114520000       114880000       #39ae00
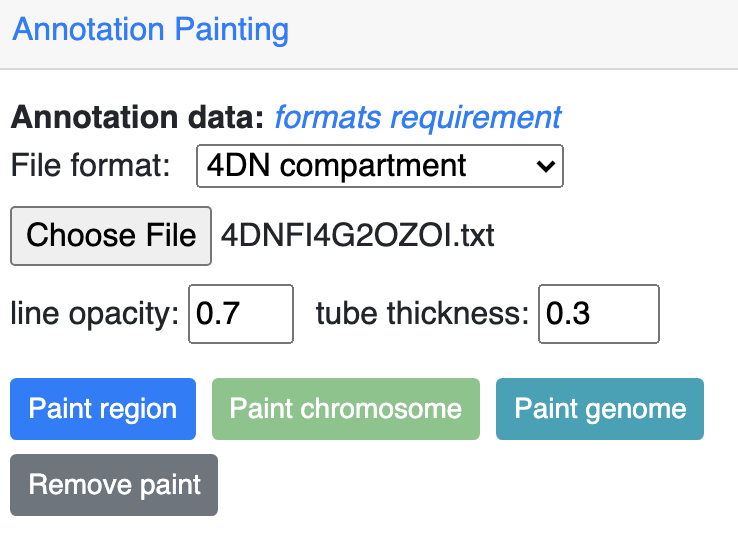
4DN compartment data
Compartment calls table file can also be used to paint the 3D structure. We supported the compartment calls data 4DNFIL65C8ZI from 4DN data portal. The file is pretty small about 1MB in size. The file can either in raw text file (example text) or in compressed gzip format example gzipped text for upload.
The 4DN compartment data looks like:
chrom       start   end     gene_count      gene_coverage   E1      E2      E3
chr1        0       100000  595     0.8812700000000001
chr1        100000  200000  952     1.0
chr1        200000  300000  159     0.09797
chr1        300000  400000  132     0.05368
chr1        400000  500000  471     0.24454
chr1        500000  600000  390     0.15467999999999998
chr1        600000  700000  229     0.05782999999999999
Rao et.al compartment data
The paper from Rao et.al published in Cell in 2014 also containes a compartment format, the format looks like below:
chr19       0       200000  NA      0       .       0       200000  255,255,255
chr19       200000  500000  B1      -1      .       200000  500000  220,20,60
chr19       500000  3800000 A1      2       .       500000  3800000 34,139,34
chr19       3800000 3900000 B1      -1      .       3800000 3900000 220,20,60
chr19       3900000 5000000 A1      2       .       3900000 5000000 34,139,34
chr19       5000000 5600000 B1      -1      .       5000000 5600000 220,20,60
Important
The uploaded file for annotation painting can be raw text file or compressed with gzip, but NOT with bgzip.
Example annotation painting
Choose the format of your data be used to painting from the dropdown menu:
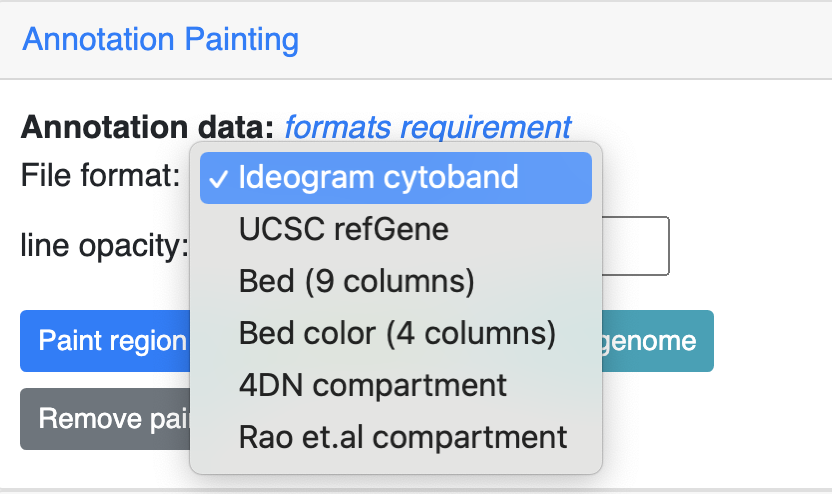
Then click one the paint button, the upload file button will appear if the format is not cytoband.
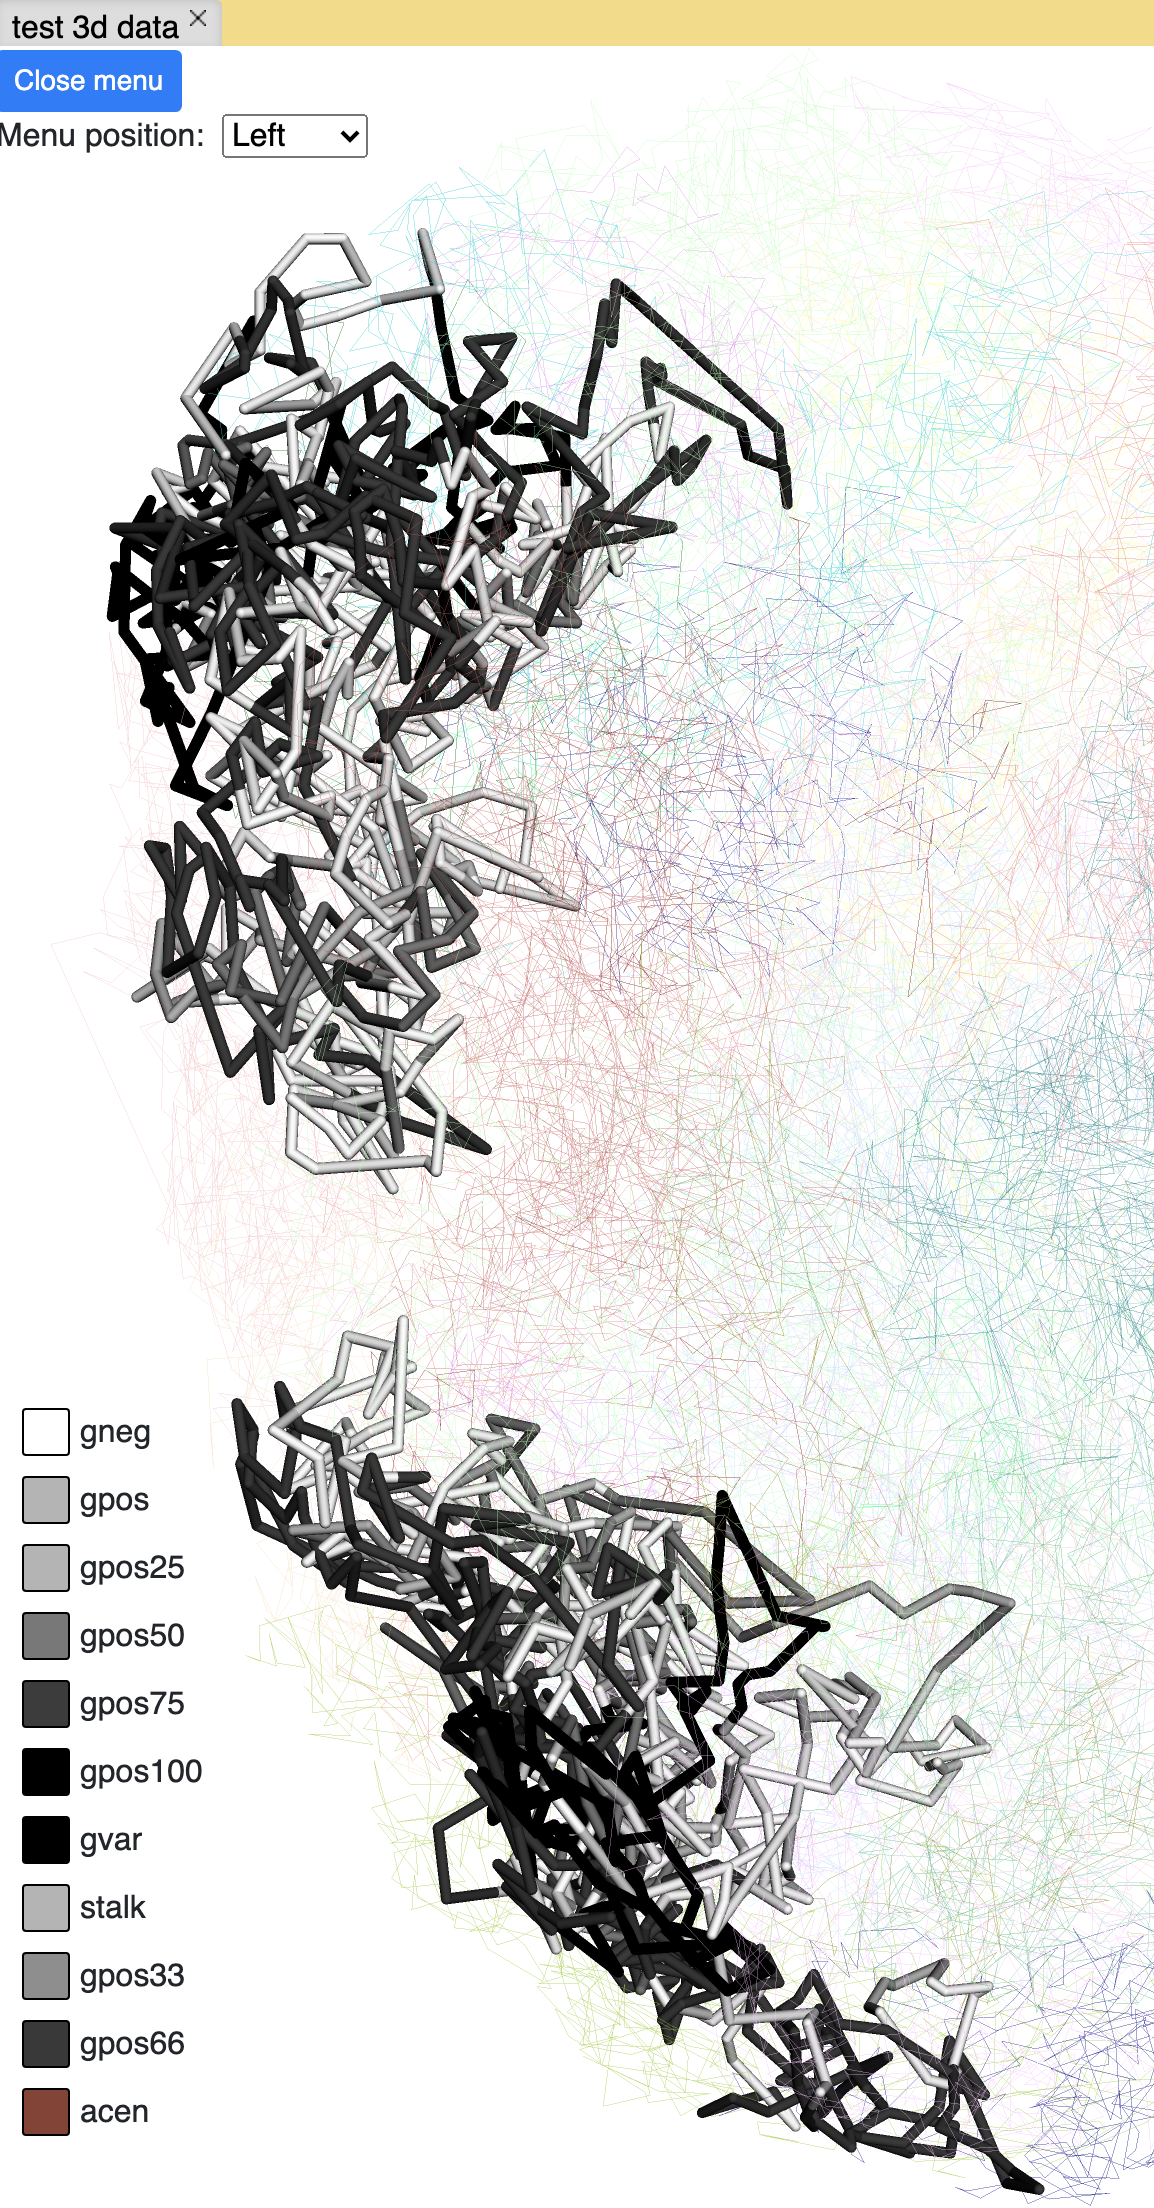
cytoband painting
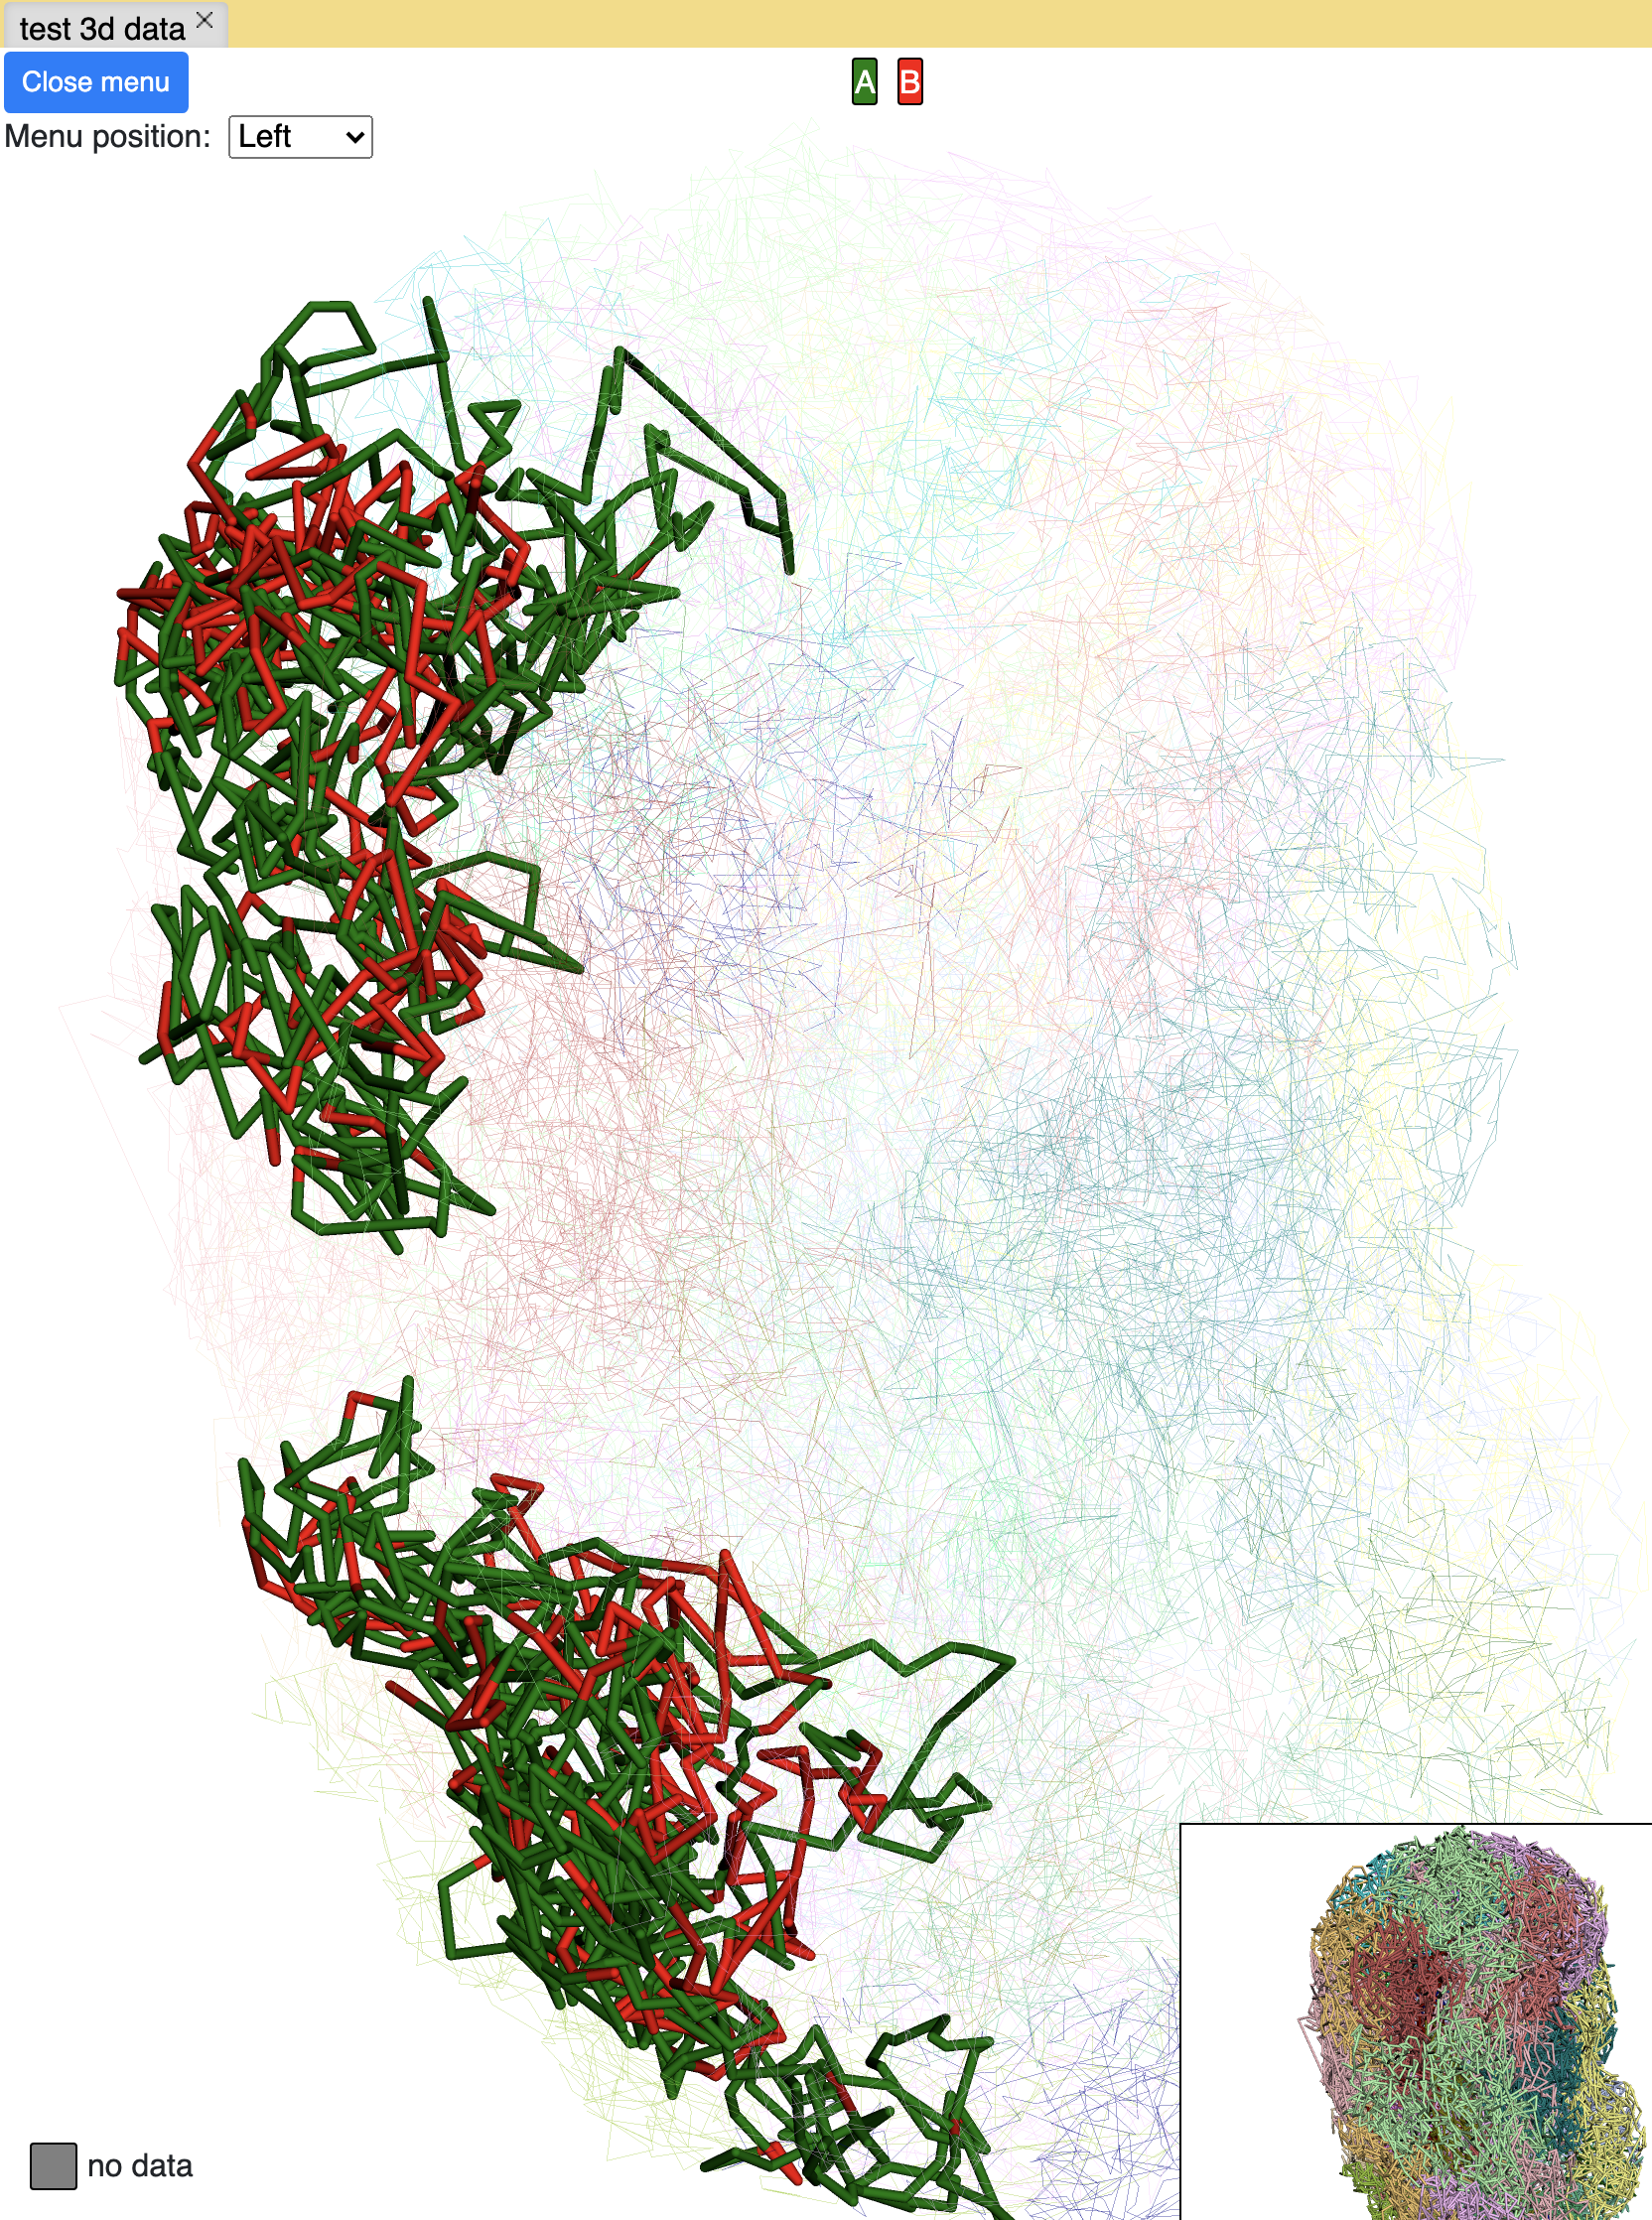
4DN compartment painting
The screenshot below is an example using the compartment calls table mentioned above to paint the whole chromosome, green part indicates compartment A and red part indicates compartment B, color can also be customized. The operations are similar to numerical painting, and the painting can also be removed with provided button.
chromHMM painting
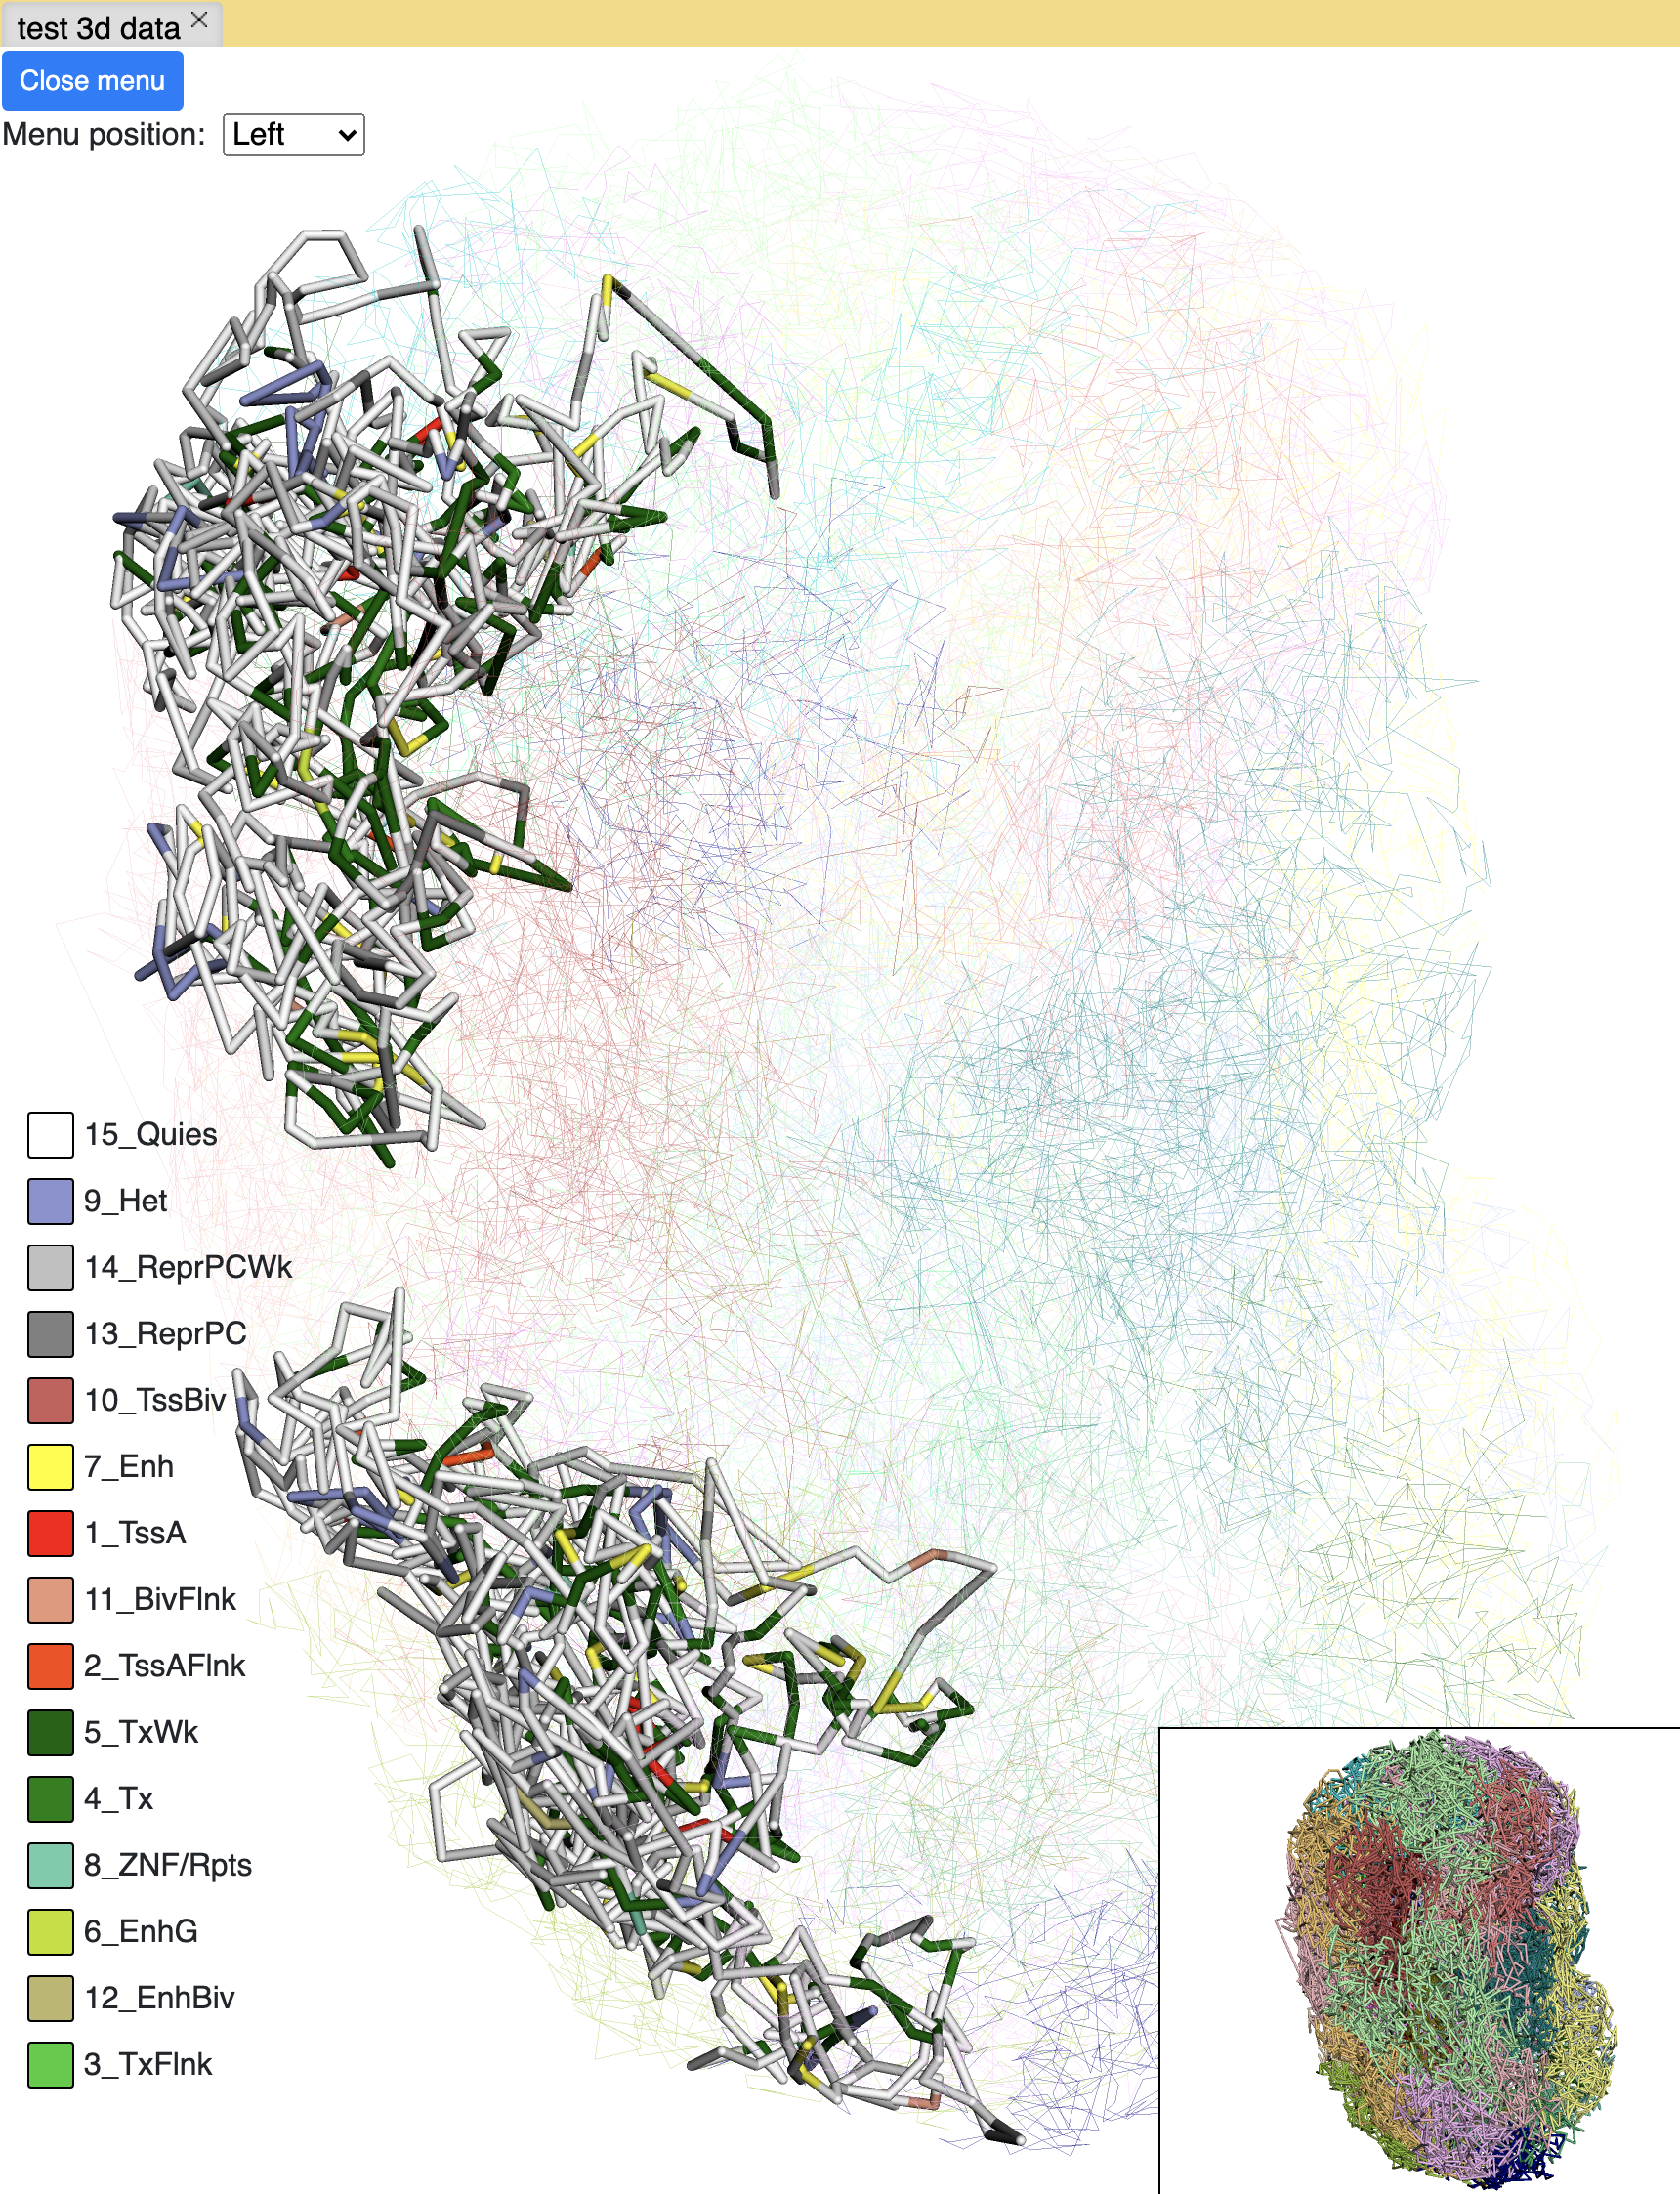
The screenshot below is an example using the chromHMM data from Roadmap to paint the whole chromosome.
Animations on 3D
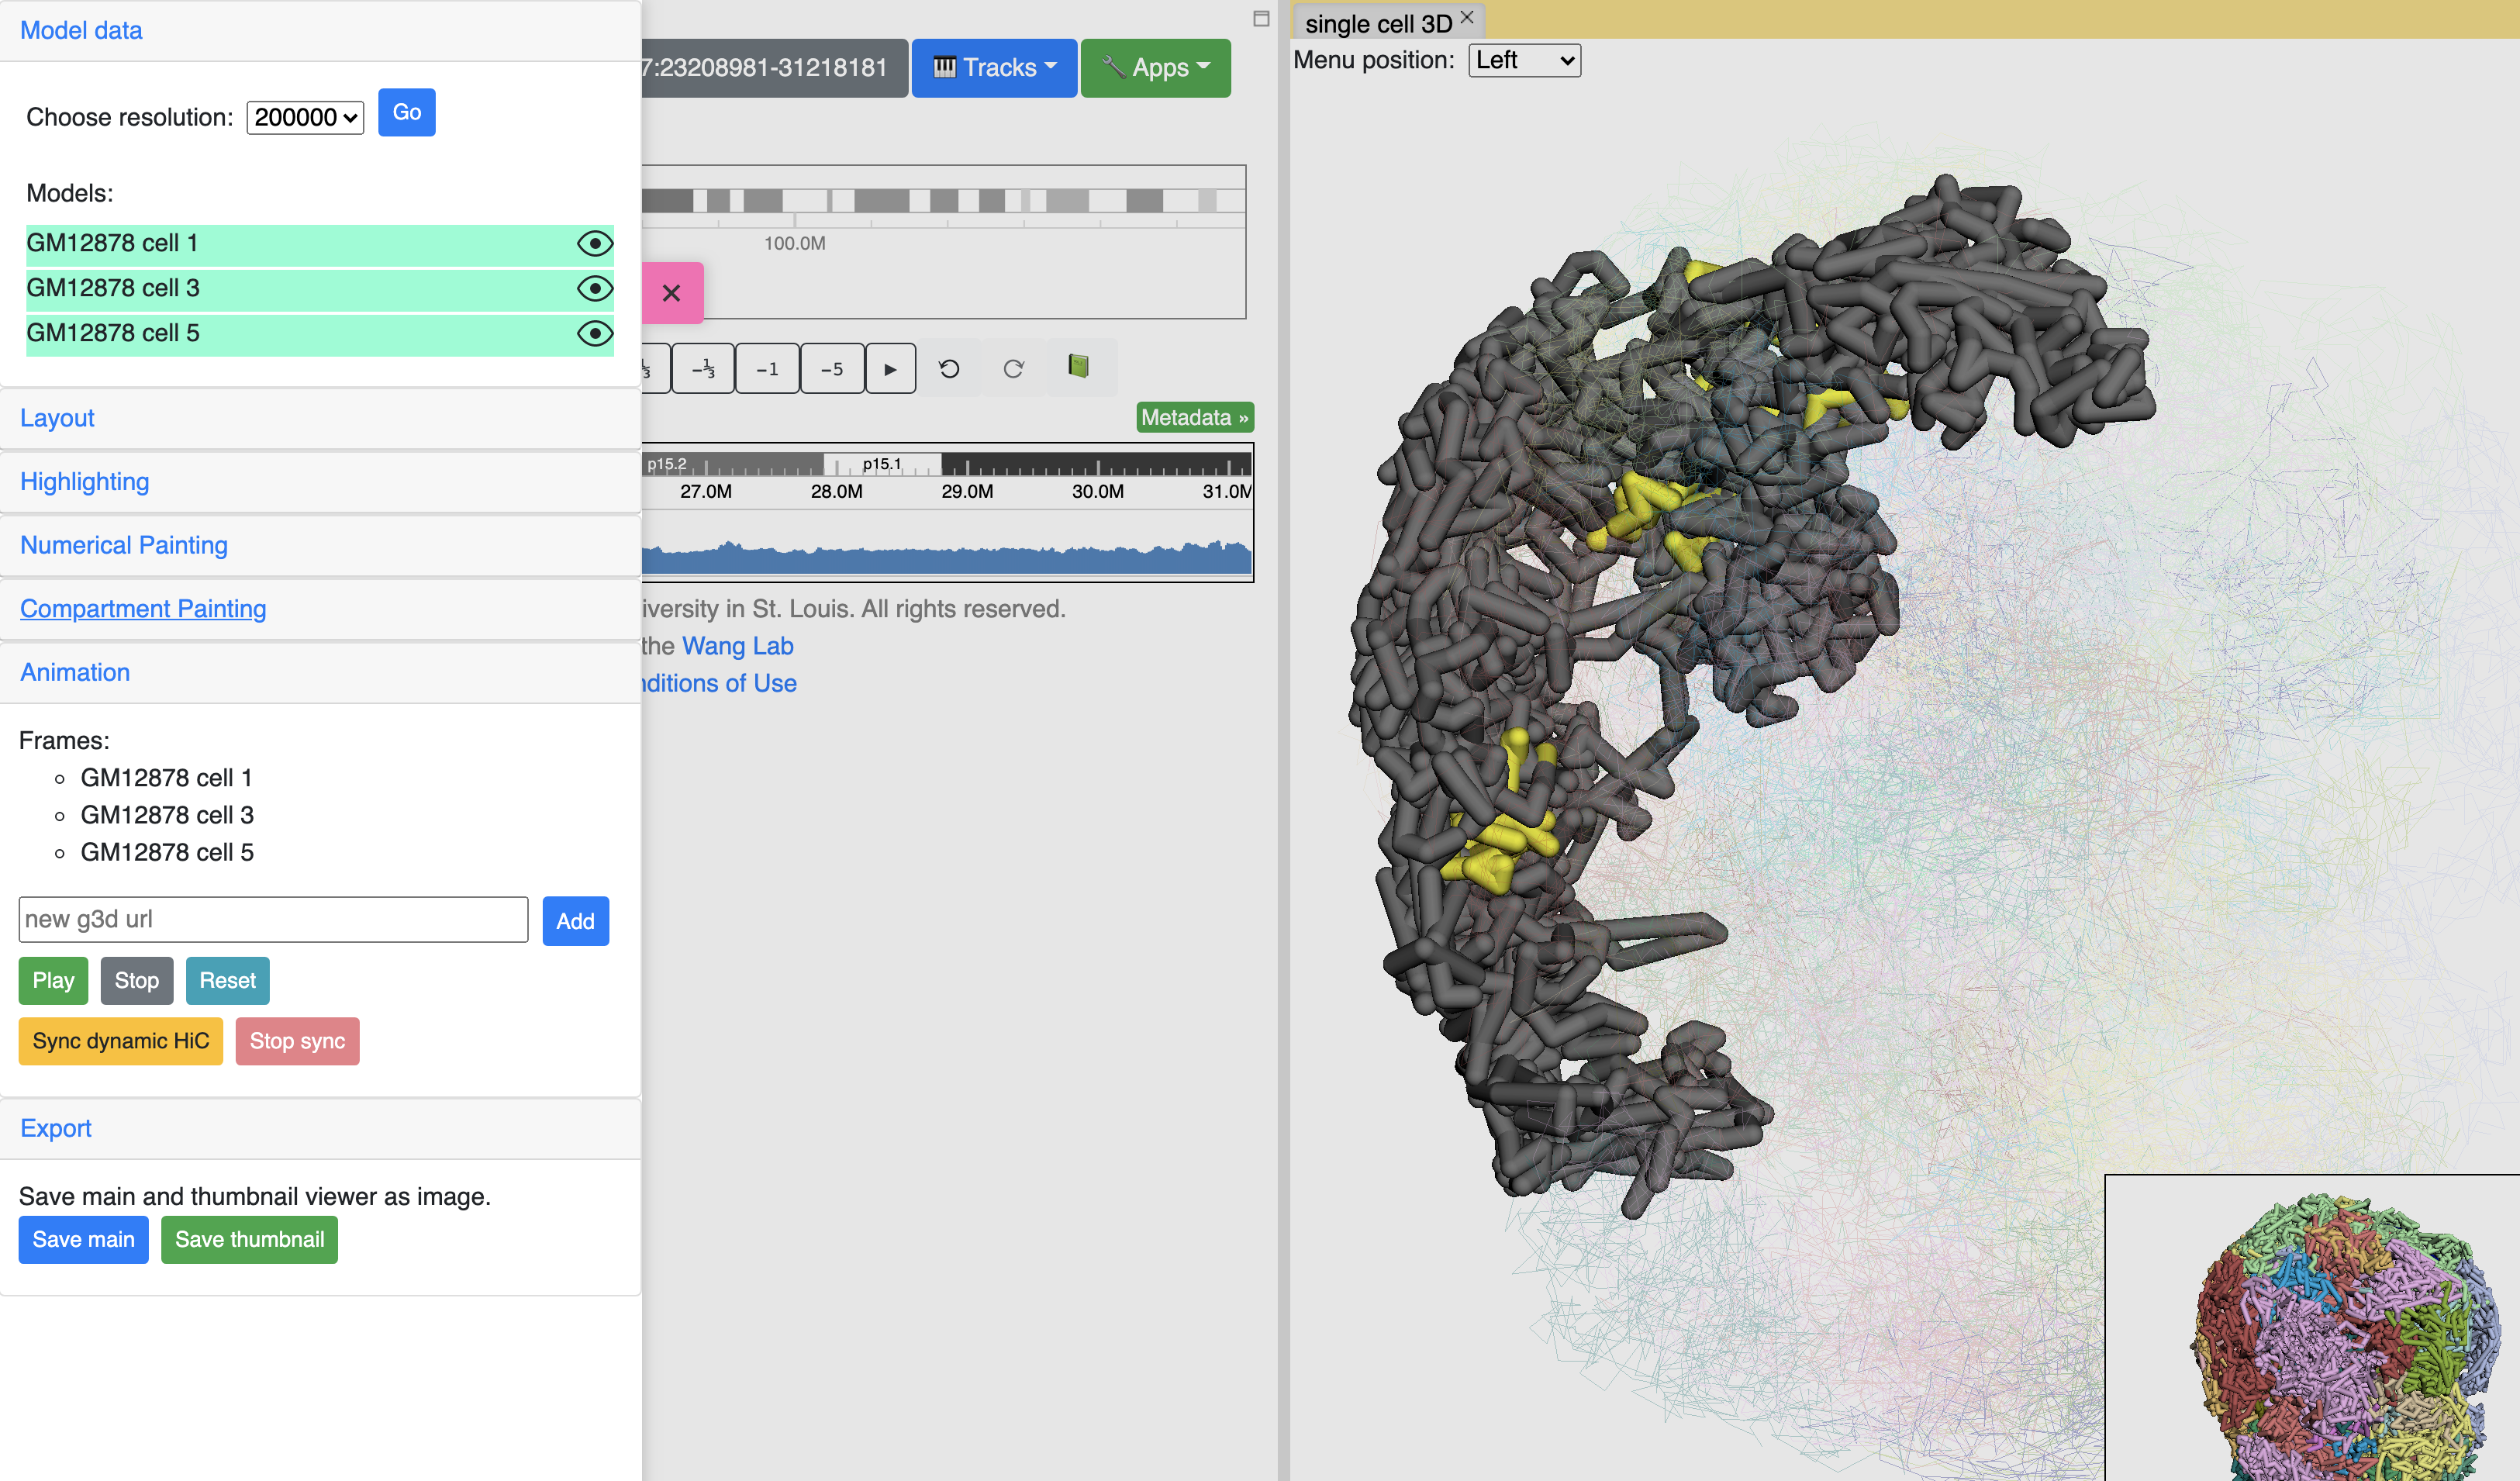
g3d format is designed to be a container file format, it might contain multiple models from haplotypes or different cells/samples, each model may also contain data at different resolution. This example file contains 3D structure data from 3 different cell at different resolutions. When there are multiple models available, the 3D viewer can play animation while each model will be displayed as a frame and loop over every model. Add this example as g3d track, this is how it looks like:
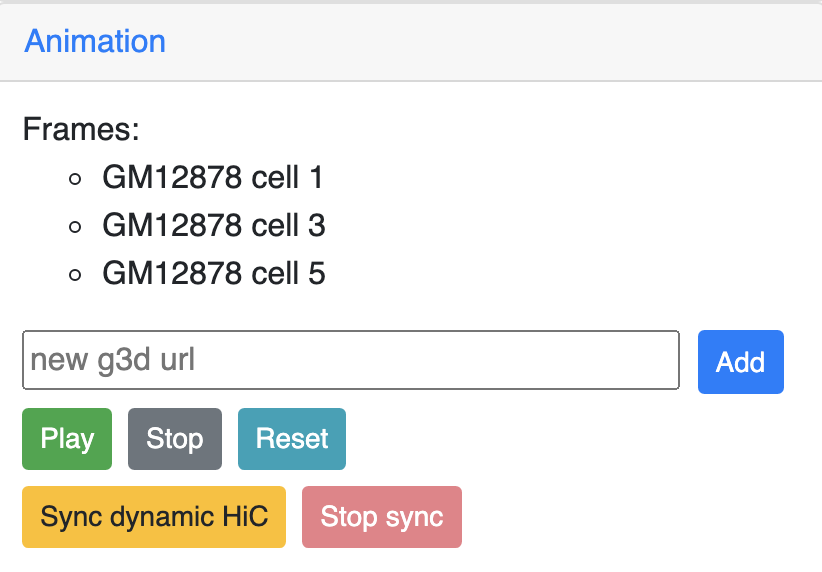
in the Animation section, click the Play button the animation will start, Stop will stop the animation, and Reset will reset the viewer to default view style.
Please check the animation below (speed was adjusted to reduce animation file size for documentation):
Sync 3D structure with dynamic hic
Since the browser have both dynamic hic track type and animation over 3D structures, there is a way to sync the animation between dynamic hic track and 3D structure. The Sync dynamic HiC button enables animation synchronization between dynamic hic and models in 3D structure. Please see the animation below for example:
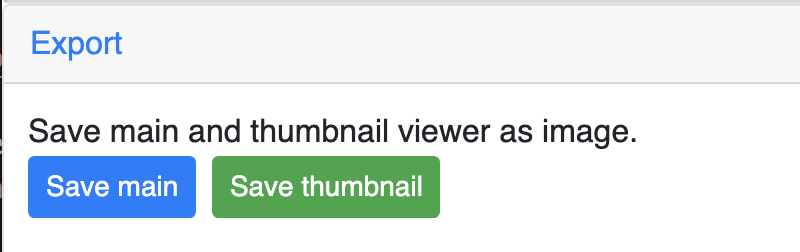
Export 3D images
The 3D viewer can export current view as image in png format for download. Simplely click the buttons under Export section, users can download the image in main and thumbnail viewer.