Datahub
A datahub is a JSON file descibing a set of tracks in the browser. A datahub file is an array of tracks, which are also defined in JSON syntax:
[
    {
    "type": "track_type1",
    "name": "track_name1",
    "url": "track_url1",
    "showOnHubLoad": true,
    "options": {
        "color": "red"
        }
    },
    {
    "type": "track_type2",
    "name": "track_name2",
    "url": "track_url2",
    "showOnHubLoad": true,
    "options": {
        "color": "blue"
        }
    }
]
Important
For each track in datahub, showOnHubLoad need set to true for the track to be displayed in browser. Tracks without showOnHubLoad set to true
won’t be displayed in browser but can be added later in track facet table.
Example data hub
Pasted below is an example data hub for mouse mm10:
[
    {
    "type": "bigwig",
    "url": "https://vizhub.wustl.edu/public/tmp/TW463_20-5-bonemarrow_MeDIP.bigWig",
    "name": "MeDIP",
    "options": {
        "color": "red",
        "backgroundColor":"#FFE7AB"
        },
    "metadata": {
        "sample": "bone",
        "assay": "MeDIP"
        }
    },
    {
    "type": "bigwig",
    "url": "https://vizhub.wustl.edu/public/tmp/TW551_20-5-bonemarrow_MRE.CpG.bigWig",
    "name": "MRE",
    "options": {
        "color": "blue",
        "backgroundColor":"#C0E3CC"
        },
    "metadata": {
        "sample": "bone",
        "assay": "MRE"
        }
    }
]
Example bigWig track
{
    "type": "bigwig",
    "name": "example bigwig",
    "url": "https://vizhub.wustl.edu/hubSample/hg19/GSM429321.bigWig",
    "options": {
        "color": "blue"
    }
}
Example dynseq track
{
    "type": "dynseq",
    "name": "example dynseq",
    "url": "https://target.wustl.edu/dli/tmp/deeplift.example.bw",
    "options": {
        "color": "blue",
        "height: 100
    }
}
Example methylC track
{
  "type": "methylc",
  "name": "H1",
  "url": "https://vizhub.wustl.edu/public/hg19/methylc2/h1.liftedtohg19.gz",
  "options": {
    "label": "Methylation",
    "colorsForContext": {
      "CG": { "color": "#648bd8", "background": "#d9d9d9" },
      "CHG": { "color": "#ff944d", "background": "#ffe0cc" },
      "CHH": { "color": "#ff00ff", "background": "#ffe5ff" }
    },
    "depthColor": "#01E9FE"
  },
}
Example categorical track
{
  "type": "categorical",
  "name": "ChromHMM",
  "url": "https://egg.wustl.edu/d/hg19/E017_15_coreMarks_dense.gz",
  "options": {
      "category": {
          "1": {"name": "Active TSS", "color": "#ff0000"},
          "2": {"name": "Flanking Active TSS", "color": "#ff4500"},
          "3": {"name": "Transcr at gene 5' and 3'", "color": "#32cd32"},
          "4": {"name": "Strong transcription", "color": "#008000"},
          "5": {"name": "Weak transcription", "color": "#006400"},
          "6": {"name": "Genic enhancers", "color": "#c2e105"},
          "7": {"name": "Enhancers", "color": "#ffff00"},
          "8": {"name": "ZNF genes & repeats", "color": "#66cdaa"},
          "9": {"name": "Heterochromatin", "color": "#8a91d0"},
          "10": {"name": "Bivalent/Poised TSS", "color": "#cd5c5c"},
          "11": {"name": "Flanking Bivalent TSS/Enh", "color": "#e9967a"},
          "12": {"name": "Bivalent Enhancer", "color": "#bdb76b"},
          "13": {"name": "Repressed PolyComb", "color": "#808080"},
          "14": {"name": "Weak Repressed PolyComb", "color": "#c0c0c0"},
          "15": {"name": "Quiescent/Low", "color": "#ffffff"}
      }
  }
}
Supported options: backgroundColor, color, color2, yScale, yMax, and yMin.
Example longrange track
{
    "type": "longrange",
    "name": "ES-E14 ChIA-PET",
    "url": "https://egg.wustl.edu/d/mm9/GSE28247_st3c.gz"
}
Example bigInteract track
{
    "type": "biginteract",
    "name": "test bigInteract",
    "url": "https://epgg-test.wustl.edu/dli/long-range-test/interactExample3.inter.bb"
}
Example repeatmasker track
{
    "type": "repeatmasker",
    "name": "RepeatMasker",
    "url": "https://vizhub.wustl.edu/public/mm10/rmsk16.bb"
}
Example geneAnnotation track
{
    "type": "geneAnnotation",
    "name": "refGene",
    "genome": "mm10"
}
Note
Please specify the genome attibute for gene annotation tracks.
Example bigbed track
{
    "type": "bigbed",
    "name": "test bigbed",
    "url": "https://vizhub.wustl.edu/hubSample/hg19/bigBed1"
}
Example bed track
{
    "type": "bed",
    "name": "mm10 bed",
    "url": "https://epgg-test.wustl.edu/d/mm10/mm10_cpgIslands.bed.gz"
}
Example refbed track
{
    "type": "refbed",
    "name": "mm10 gencode basic",
    "url": "https://vizhub.wustl.edu/public/tmp/gencodeM18_load_basic_Gene.bed.gz",
    "options": {
            "categoryColors": {
                "coding": "rgb(101,1,168)",
                "nonCoding": "rgb(1,193,75)",
                "pseudo": "rgb(230,0,172)",
                "problem": "rgb(224,2,2)",
                "other":"rgb(128,128,128)"
            }
        }
}
Note
categoryColors designates colors for the gene type as indicated in the 9th column. The default scheme is shown above for
the five classes created by the Converting_Gencode_or_Ensembl_GTF_to_refBed.bash script, but any number of categories can
be defined.
Example HiC track
{
    "type": "hic",
    "name": "test hic",
    "url": "https://epgg-test.wustl.edu/dli/long-range-test/test.hic",
    "options": {
        "displayMode": "arc"
    }
}
Example cool track
{
    "type": "cool",
    "name": "Aiden et al. (2009) GM06900 HINDIII 1kb",
    "url": "Hyc3TZevQVm3FcTAZShLQg",
    "options": {
        "displayMode": "arc"
    }
}
Note
please note we are using the uuid Hyc3TZevQVm3FcTAZShLQg here from higlass API server instead of a file URL
to represent a cool track.
Example genomealign track
{
    "name": "hg19 to mm10 alignment",
    "type": "genomealign",
    "metadata": {
        "genome": "mm10"
    }
}
Example qBED track
{
    "type":"qbed",
    "url":"https://htcf.wustl.edu/files/RdNgrGeQ/HCT116-PBase.qbed.gz",
    "name":"piggyBac insertions",
    "showOnHubLoad":"true",
    "options":{
        "color":"#D12134",
        "height":100,
        "logScale":"log10",
        "show":"sample",
        "sampleSize":1000,
        "markerSize":5,
        "opacity":[50],
      },
}
Note
Default qBED track options are "logScale":"none", "show":"all", "markersize":3, and "opacity":[100].
Log-scaling can be set by specifying "logScale":"log10". To change opacity, pass a single value in brackets, as in the above example.
qBED tracks will, by default, plot all entries in view. For information-dense regions, this can lead to excessive memory consumption.
To plot a random subsample instead, specify "show":"sample" and pass the number of points to visualize to "sampleSize", e.g.
"sampleSize":1000
Example matplot track
{
    "type": "matplot",
    "name": "matplot wrap",
    "tracks": [
        {
        "type": "bigwig",
        "url": "https://vizhub.wustl.edu/public/tmp/TW463_20-5-bonemarrow_MeDIP.bigWig",
        "name": "MeDIP",
        "options": {
            "color": "red",
            "backgroundColor":"#FFE7AB"
            },
        "metadata": {
            "sample": "bone",
            "assay": "MeDIP"
            }
        },
        {
        "type": "bigwig",
        "url": "https://vizhub.wustl.edu/public/tmp/TW551_20-5-bonemarrow_MRE.CpG.bigWig",
        "name": "MRE",
        "options": {
            "color": "blue",
            "backgroundColor":"#C0E3CC"
            },
        "metadata": {
            "sample": "bone",
            "assay": "MRE"
            }
        }
    ]
}
Example g3d track
{
    "type": "g3d",
    "url": "https://wangftp.wustl.edu/~dli/tmp/test.g3d",
    "name": "example 3d track",
    "showOnHubLoad": true
}
Example Ruler track
{
    "type": "ruler",
    "name": "Ruler"
}
Track properties
type
Requried. type specifies the track type, currently supported track types:
bigWig
bedGraph
dynseq
methylC
categorical
hic
bed
bigbed
refbed
repeatmasker
geneAnnotation
genomealign
longrange
bigInteract
qBED
matplot
snp
ruler
Note
type is case insensitive.
name
Requried. name specifies the track name used internally by the browser. It is also
displayed as the track legend if no label speficied. Value can be any string.
label
Optional. label specifies the track legend displayed in the browser. It overrides the name arrtibute.
Value can be any string.
url
Requried. url contains the URL to the track file and needs to be HTTP or HTTPS location string.
Important
A url is requried for all the tracks in binary format. Gene annotaion tracks,
like refGene, do not need a url as they are stored in the Mongo database.
Additional annotation tracks, such as the ruler track, also do not need a url.
Caution
Each user-provided url must link to a publically available website, without password
protection, so that the browser can read in the file.
Note
url can use a relative child path to the datahub url, say you have a file a.bigWig with your
datahub http://your.host/your.hub.json, when you add the track entry for a.bigWig, the url can
be either http://your.host/a.bigWig or just a.bigWig.
showOnHubLoad
Optional. If specified to true, the track will be displayed when hub is loaded. Default value: false.
metadata
Optional. An object specifying the metadata of the track.
In this basic example the value of each metadata term is a string.
"metadata": {
    "sample": "bone",
    "assay": "MRE"
}
You can also use this syntax for customized color:
"sample": {"name"" "bone", "color": "#FF0000"}
The value of color can also be “red”, “blue”, and any CSS color.
This example public Roadmap data hub has more complex metadata definitions and makes use of a list of strings to build a hierarchical structure.
{
    "url": "https://egg.wustl.edu/d/hg19/GSM997242_1.bigWig",
    "metadata": {
        "Sample": [
            "Adult Cells/Tissues",
            "Blood",
            "Other blood cells",
            "CD4+_CD25-_Th_Primary_Cells"
        ],
        "Donor": [
            "Donor Identifier",
            "Donor_332"
        ],
        "Assay": [
            "Epigenetic Mark",
            "Histone Mark",
            "H3",
            "H3K9",
            "H3K9me3"
        ],
        "Institution": [
            "Broad Institute"
        ]
    },
    "type": "bigwig",
    "options": {
        "color": "rgb(159,0,72)"
    },
    "name": "H3K9me3 of CD4+_CD25-_Th_Primary_Cells"
}
The list of metadata is ordered from more generic to more specific and helps build the facet table hierarchy making the search and filter functions in track table easier.
details
Optional. If you want to add more information for each track then the details attribute is helpful.
After right clicking on the track you can click More Information and see the
details, url, and metadata for each track in the dropdown menu.
"details": {
    "data source": "Roadmap Project",
    "date collected": "May 7 2016"
}
queryEndPoint
Optional. Most time this parameter will be used with geneAnnotation track. When users deal with custom genome, or genome not listed in NCBI or Ensembl database, gene search link would not work, so in such case, user can specify a custom database to query detailed information. For example, for some trypanosome genome, gene search should be queried through TriTryDB, we can define the track like this then:
{
    type: "geneAnnotation",
    name: "gene",
    label: "TriTrypDB genes",
    genome: "TbruceiLister427",
    queryEndpoint: { name: "TriTrypDB", endpoint: "https://tritrypdb.org/tritrypdb/app/search?q=" },
}
options
Optional. All track render options are placed in an object called options.
This object can have the following properties:
color
color is used to define the color for each track. A color name, RGB values, or hex color code can be used.
For more about color name or RGB please see https://www.w3schools.com/css/css_colors.asp.
color2
color2 is used to define the color for negative values from the track data. The default is
the same as color.
backgroundColor
backgroundColor defines the background color of the track.
height
height controls the height of the track which is specified as a number and displayed in pixels.
ensemblStyle
currently for bigwig track, specify ensemblStyle option to true can enable data with chromosome names as 1, 2, 3…work in the browser
yScale
yScale allows you to configure the track’s y-scale. Options include auto or fixed.
auto sets the y-scale from 0 to the max value of values in the view region for a given track.
fixed means you can specify the minimal and maximal value.
yMax
yMax is used to define the maximum value of a track’s y-axis. Value is number.
yMin
yMin is used to define the minimum value of a track’s y-axis. Value is number.
Important
If you need the track to be in fixed scale, you need to specify yScale to fixed
besides of set yMax and yMin.
group
Numerical tracks can be grouped to same group, tracks from same group will share y-axis scale settings. For example, when 2 tracks are
in one group, the y-axis will both set to max value of current views of both tracks. Users can find one example data hub with group settings from here: https://wangftp.wustl.edu/~dli/test/a-group.json
scoreScale/scoreMax/scoreMin
These options work similar as yScale/yMax/yMin, but these are for interaction tracks.
colorAboveMax
colorAboveMax defines the color displayed when a fixed yScale is used and a value exceeds the
yMax defined.
color2BelowMin
color2BelowMin defines the color displayed when a fixed yScale is used and a value is below the
yMin defined.
displayMode
displayMode specifies display mode for each tracks. Different tracks have different display modes as listed below.
type |
display mode |
|---|---|
bigWig |
auto, bar, heatmap |
bedGraph |
auto, bar, heatmap |
geneAnnotation |
full, density |
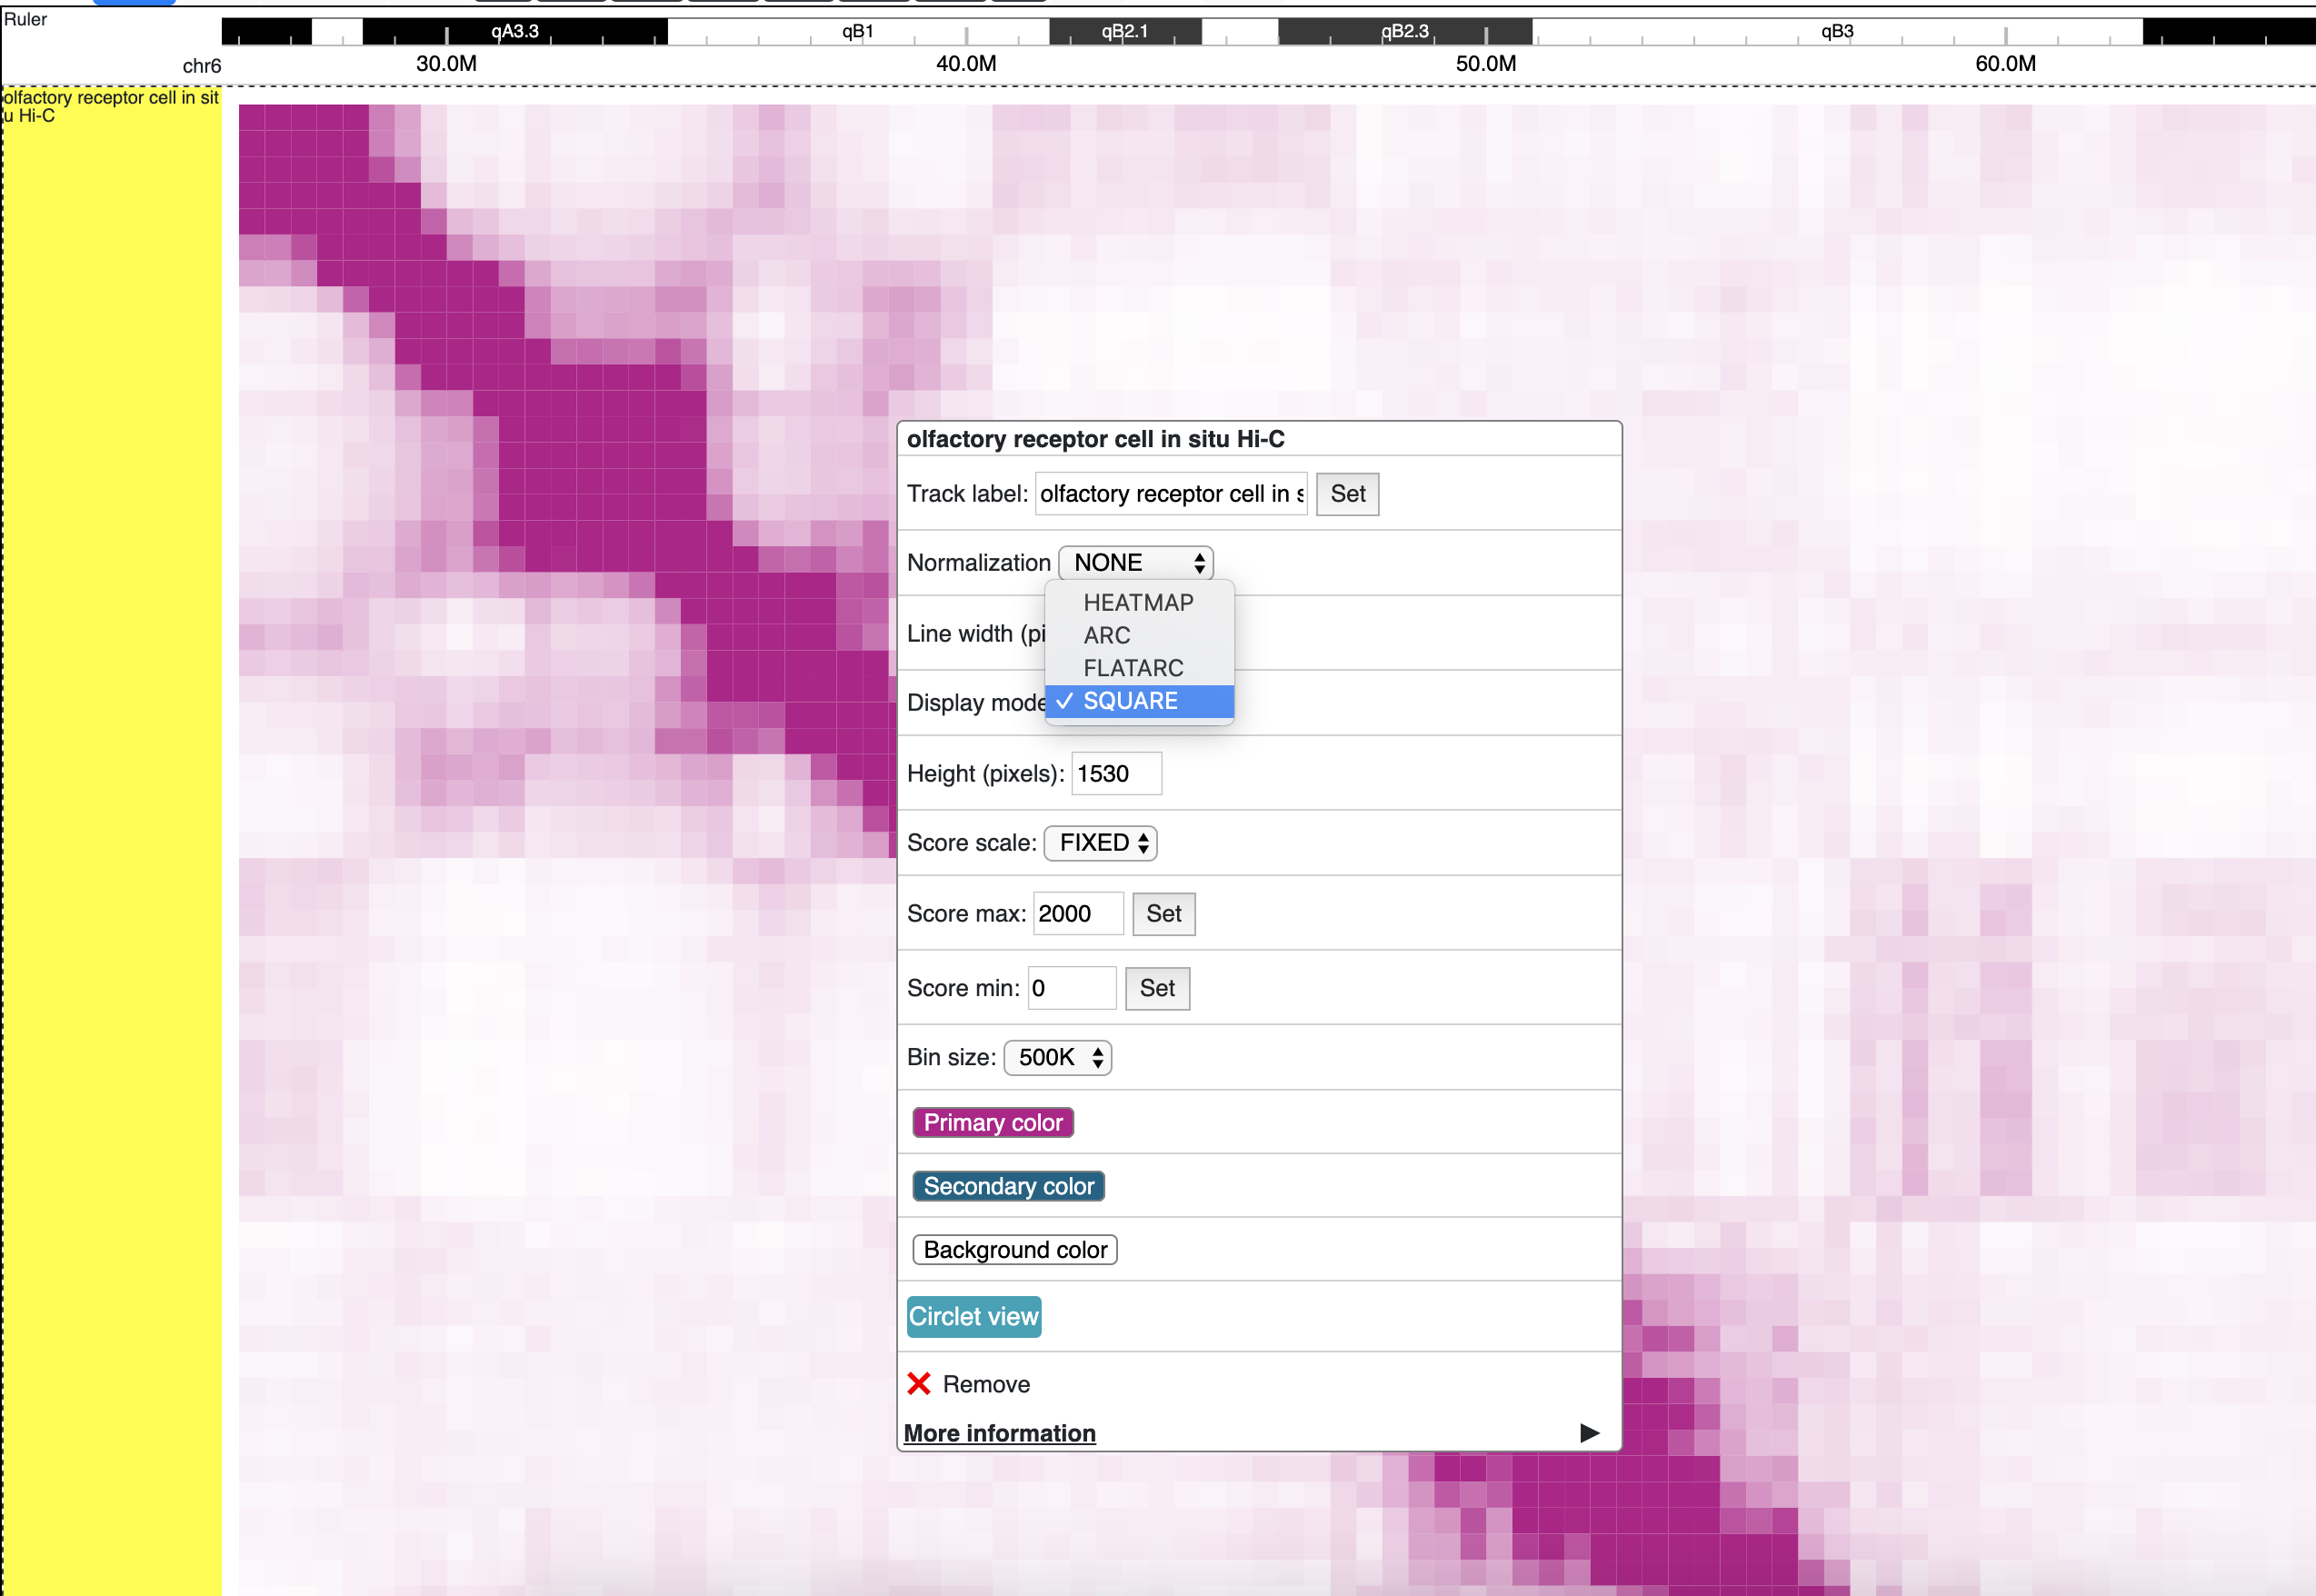
HiC |
arc, heatmap, flatarc, square |
genomealign |
rough, fine |
flatarc mode
For interaction track. flatarc mode is like arc mode, sometimes the curve would be displayed flatter, in fact it’s a cubic curve.
square mode
For interaction track. square mode gives JuiceBox style like view for HiC maps.
aggregateMethod
At high zoom-out level when 1 on-screen pixel spans >1bp, the underlying track data needs to be
summarized into a single value for browser display.
aggregateMethod is used to control how the data is summarized. Supported values include:
MEAN, SUM, COUNT, MAX, MIN. Default value is MEAN.
smooth
smooth option allows you to smooth the graph of a quantitative track using window mean values.
The browser will use the mean values from region [current_position - smooth, current_position + smooth].
Default value is 0 (no smooth applied).
maxRows
maxRows options controls the number of rows for the annotation track, like a geneAnnotation track.
isCombineStrands
For methylC tracks, isCombineStrands will specificy if the strands should be combined true or not combined false. We recommend combining stands for viewing CpG methylation, but leaving strand information for non-CpG methylation.
depthFilter
For methylC tracks a depthFilter can be set to filter out any bases with less than the depth(coverage) specified.
depthColor
For methylC tracks specify a depthColor for the depth line that overlays the bars.
maxMethyl
For methylC tracks specify the y-axis max (for both strands) using maxMethyl. Options range from (0-1].
zoomLevel
For bigWig track only. bigWig files usually contain multiple resolutions, when viewing a large region,
the Browser usually fetches a lower resolution for faster response, user can change this behaviour by changing this option.
The example below first show viewing a bigWig track in a big region with AUTO zoom level, you can see the data is pretty flat,
when we change zoom level to 0, 1, etc, we can see more details from the data, but takes more time to load.
Automatical zoom level:

Right click, change zoom level to 0: (can also setup in data hub under options)
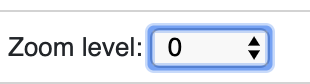
View changed after change zoom level to 0:

alwaysDrawLabel
For bed and categorical tracks only. Usually for each bed and ``categorical` item in those tracks,
the label are only drawn only when there are enough space inside the item block, by specificy this option to true,
the label will always be drawn in the screen.